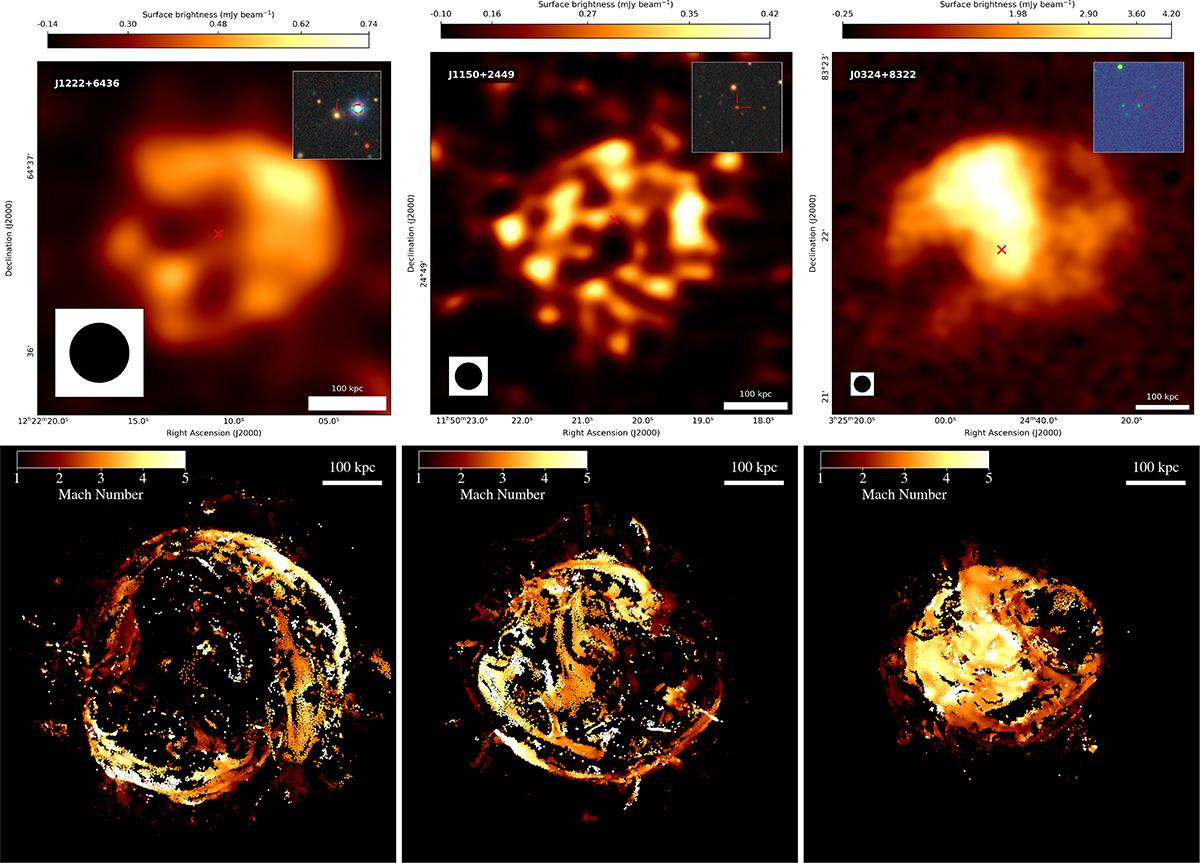
Fig. 12.
Download original image
Morphological comparison between a set of targets presented in this paper (top row) with a simulation by Ivleva et al. (2025, bottom row). The red cross in the observed objects marks the position of the optical counterpart shown in the inset at the top right corner of each panel, while the beam size is indicated at the bottom left. The color in the images of the simulation displays the local Mach number of a shock, which is triggered by a major merger event inside the galaxy group. The morphology and size of the observed objects fits the simulated counterpart well, which in each of the three cases is shown at a different projection and time.
Current usage metrics show cumulative count of Article Views (full-text article views including HTML views, PDF and ePub downloads, according to the available data) and Abstracts Views on Vision4Press platform.
Data correspond to usage on the plateform after 2015. The current usage metrics is available 48-96 hours after online publication and is updated daily on week days.
Initial download of the metrics may take a while.