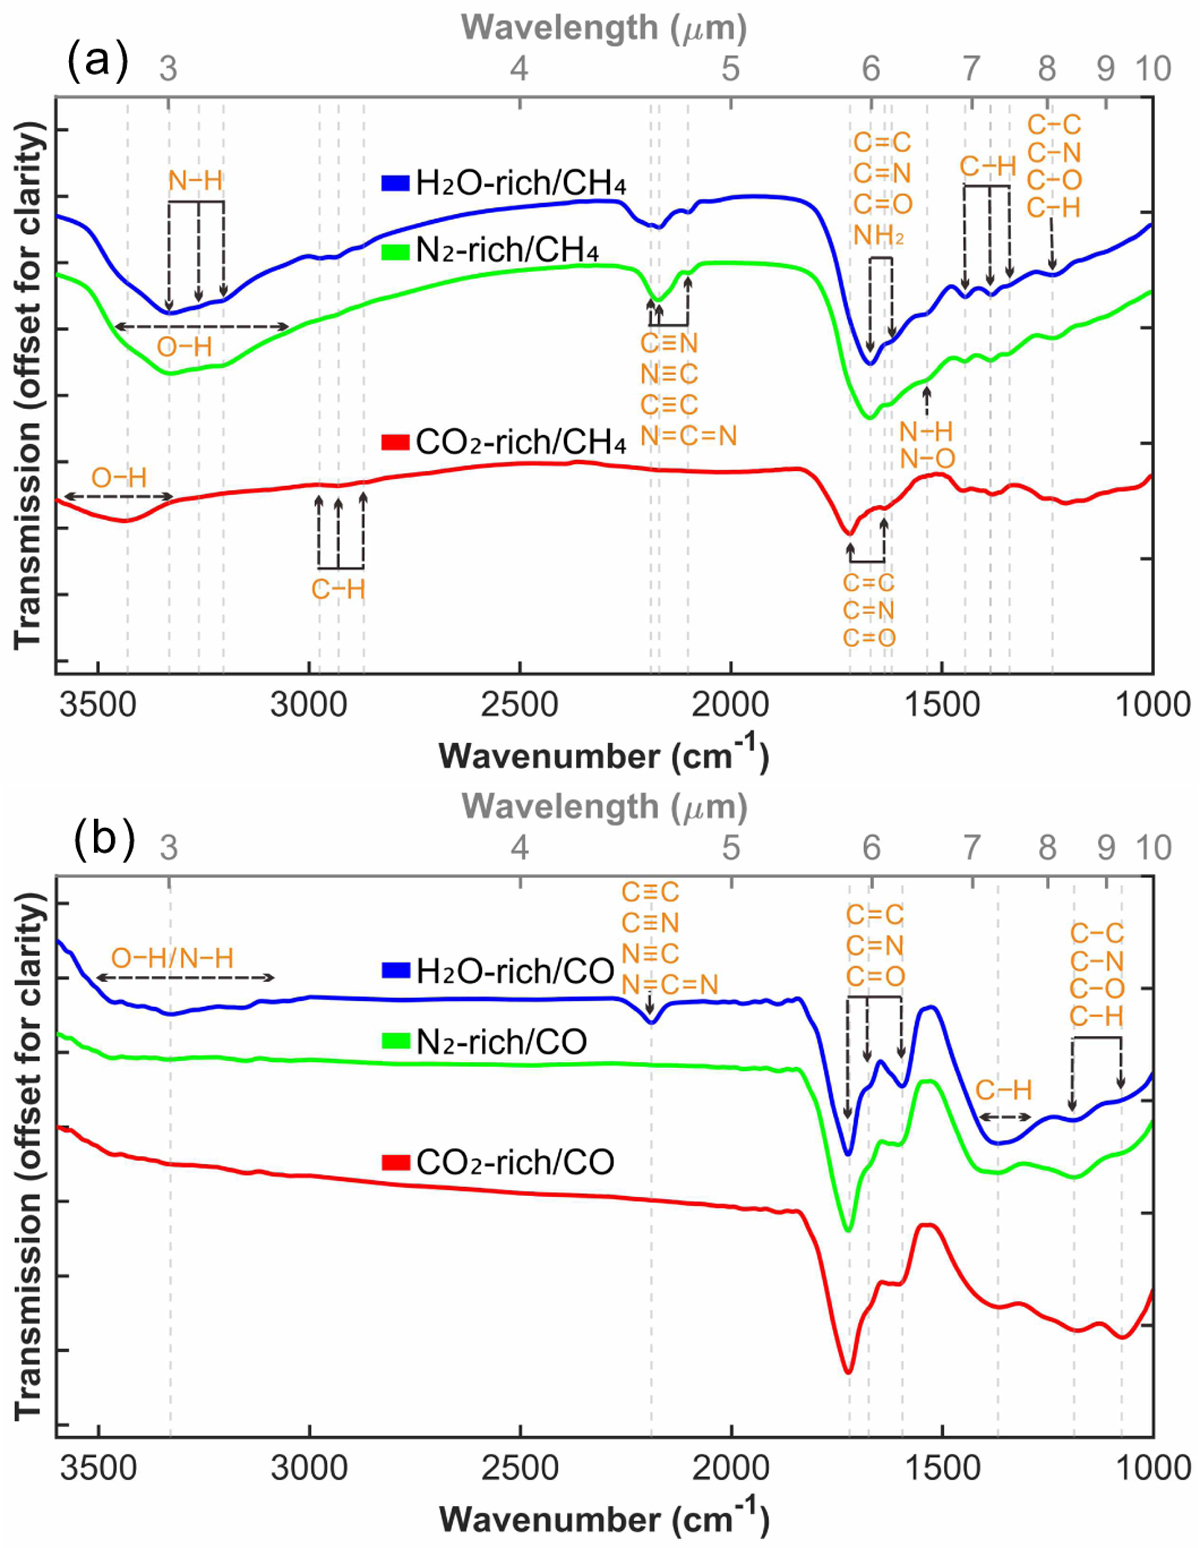
Fig. 6
Download original image
Infrared transmittance spectra of haze samples from the six experiments. (a) Transmittance spectra (3600–1000 cm−1) of haze particles formed with CH4 as the carbon source. (b) Transmittance spectra (3600–1000 cm−1) of haze particles formed with CO as the carbon source. The blue, green, and red lines represent the H2O-rich, N2-rich, and CO2-rich conditions, respectively. The spectra are vertically offset and rescaled for clarity, with all peaks within each spectrum multiplied by the same constant factor so that relative peak intensities and peak positions are preserved.
Current usage metrics show cumulative count of Article Views (full-text article views including HTML views, PDF and ePub downloads, according to the available data) and Abstracts Views on Vision4Press platform.
Data correspond to usage on the plateform after 2015. The current usage metrics is available 48-96 hours after online publication and is updated daily on week days.
Initial download of the metrics may take a while.