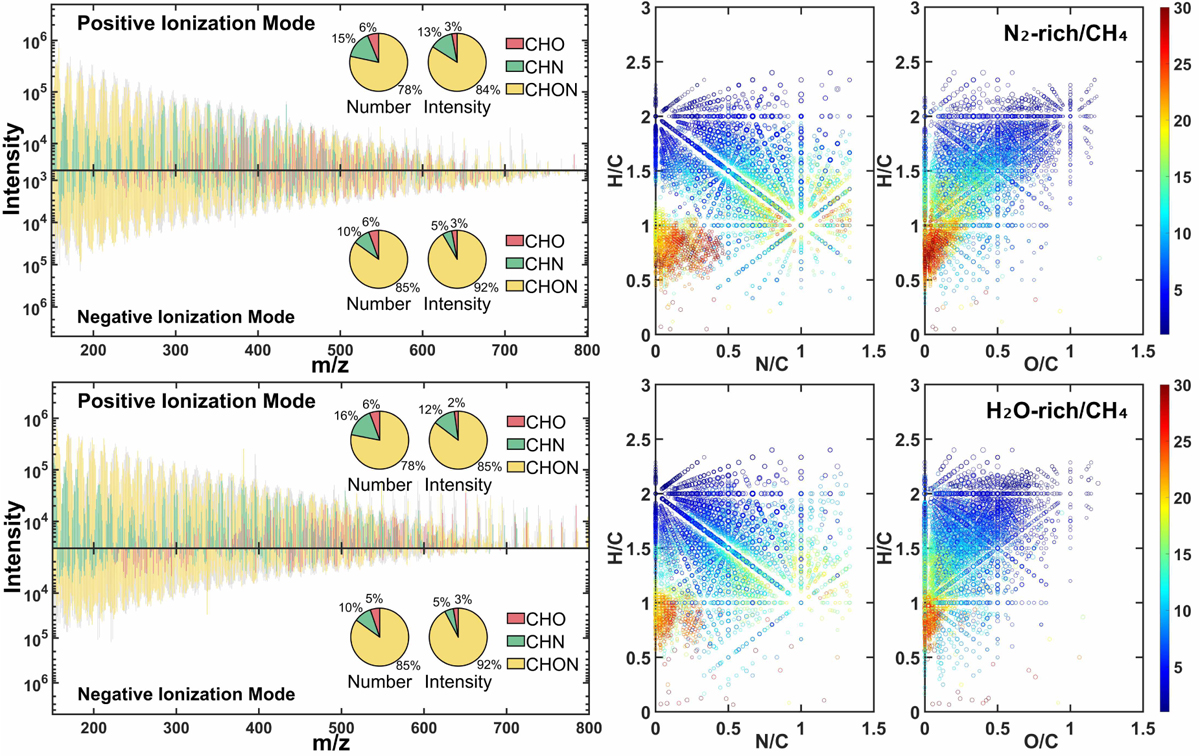
Fig. 7
Download original image
Molecular composition of haze samples from the N2-rich/CH4 and H2O-rich/CH4 experiments. Left panels: very high-resolution mass spectra (m/z 150–800) of haze particles produced from the N2-rich/CH4 and H2O-rich/CH4 experiments, acquired in both positive and negative ionization modes. Assigned CHO, CHN, and CHON species are shown in red, green, and yellow, respectively, while the gray data points correspond to mass peaks with no formula matched within the mass accuracy threshold (<0.0001 Da). For each spectrum, the adjacent pie charts summarize the percentage of molecular formulas and their relative abundances based on the summed peak intensities of the assigned organic species. Right panels: corresponding van Krevelen diagrams combining matched formulas from both ionization modes, shown as H/C vs. N/C and H/C vs. O/C. Each circle represents an assigned formula, where color denotes the degree of unsaturation and marker size scales with peak intensity.
Current usage metrics show cumulative count of Article Views (full-text article views including HTML views, PDF and ePub downloads, according to the available data) and Abstracts Views on Vision4Press platform.
Data correspond to usage on the plateform after 2015. The current usage metrics is available 48-96 hours after online publication and is updated daily on week days.
Initial download of the metrics may take a while.