Fig. 7
Download original image
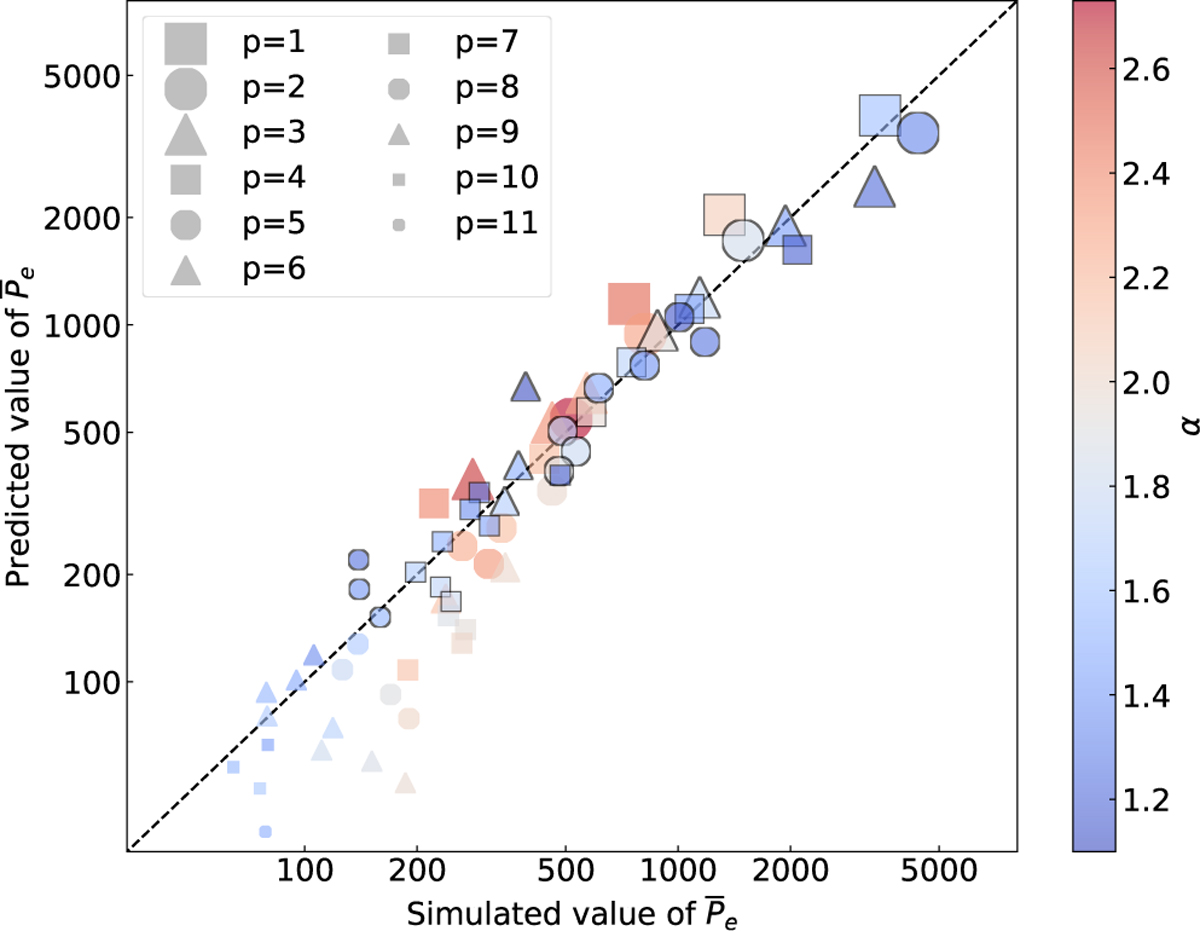
Distribution of the average capture capability, Pe, across different MMRs. The horizontal axis represents the measured Pe from simulation data, while the vertical axis represents the Pe predicted by Eq. (4), both on logarithmic scales. MMRs with different p values are denoted by different markers and the color indicates the α value of the MMR. Points with black borders are the MMRs that have capture records in all simulations, while those without borders are the MMRs have capture records in only some of the simulations.
Current usage metrics show cumulative count of Article Views (full-text article views including HTML views, PDF and ePub downloads, according to the available data) and Abstracts Views on Vision4Press platform.
Data correspond to usage on the plateform after 2015. The current usage metrics is available 48-96 hours after online publication and is updated daily on week days.
Initial download of the metrics may take a while.