Fig. 1
Download original image
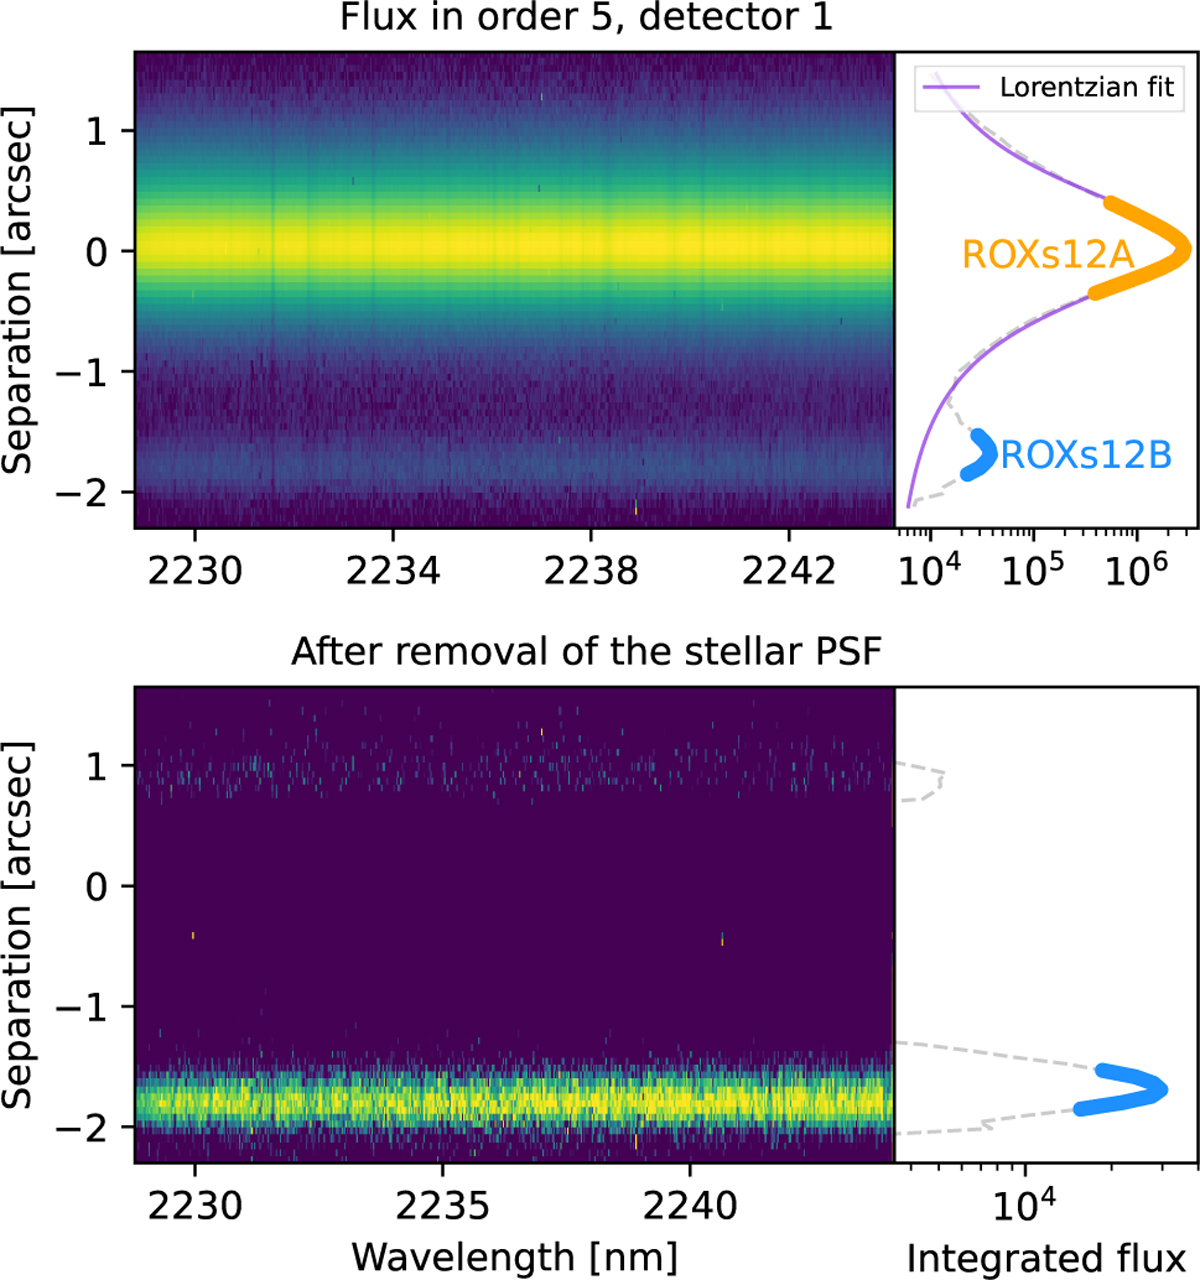
Calibrated observational data of order 5, detector 1, nodding position A. The x-axis on the left panels shows the wavelength in nanometers, while the separation from the star in arcseconds is shown on the y-axis. The bright signal in the center is the star ROXs 12A. Its companion ROXs 12B is seen as the faint source at-1.7 arcsec. The integrated flux as a function of the separation is shown in the right panels, where the extraction range of the star and companion are highlighted. The Lorentzian fit to the stellar PSF is shown in purple, which is used to remove the starlight, as shown in the bottom panel.
Current usage metrics show cumulative count of Article Views (full-text article views including HTML views, PDF and ePub downloads, according to the available data) and Abstracts Views on Vision4Press platform.
Data correspond to usage on the plateform after 2015. The current usage metrics is available 48-96 hours after online publication and is updated daily on week days.
Initial download of the metrics may take a while.