Fig. 3
Download original image
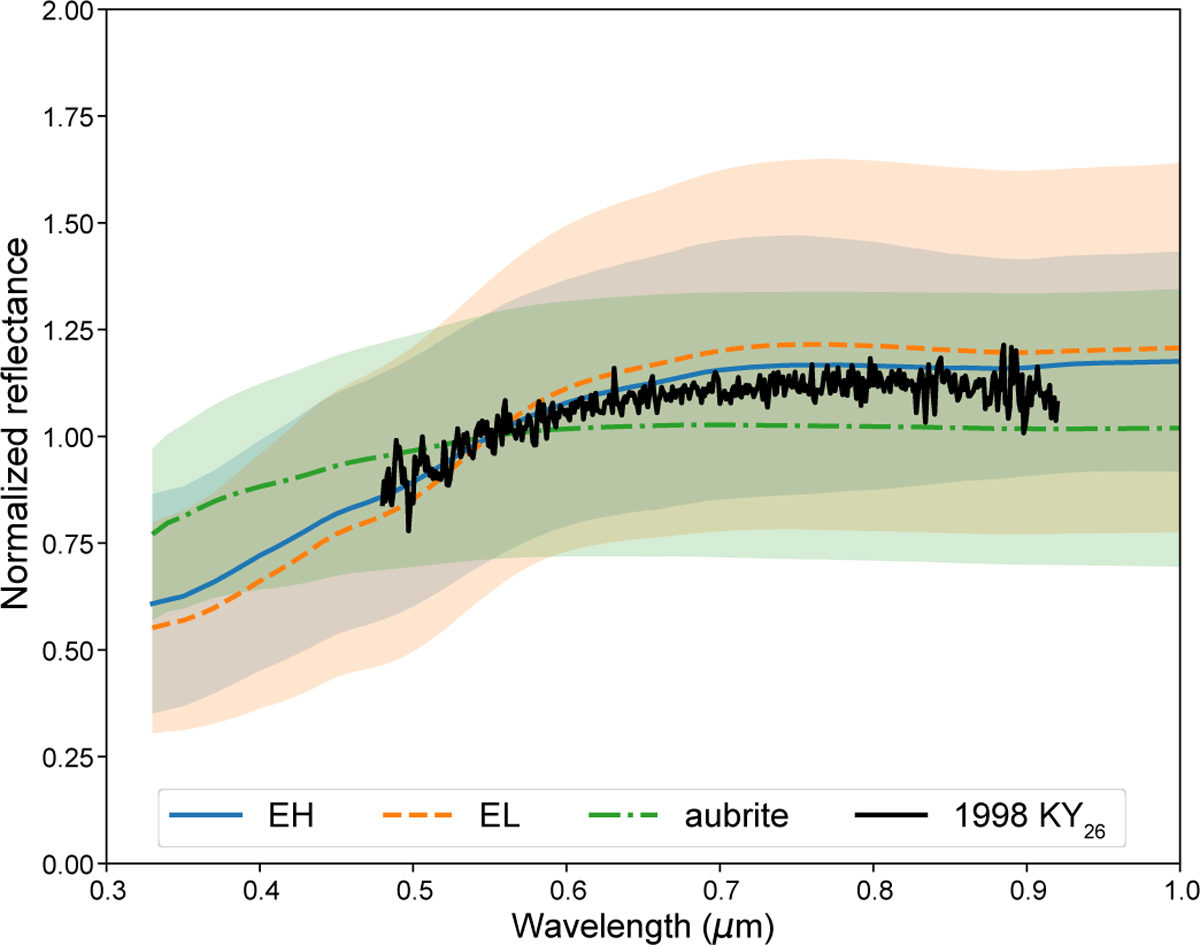
Mean normalized reflectance spectra and standard deviation (shaded areas) for aubrites (dot-dashed green line), EH chondrites (solid blue line), and EL chondrites (dashed orange line) from the RELAB database, measured at a 30◦ phase angle. This highlights the flatter profile of aubrites versus the steeper slopes of enstatite chondrites. The spectrum of 1998 KY26 exhibits a shape consistent with EL/EH chondrites but a higher absolute reflectance typical of the aubrite group.
Current usage metrics show cumulative count of Article Views (full-text article views including HTML views, PDF and ePub downloads, according to the available data) and Abstracts Views on Vision4Press platform.
Data correspond to usage on the plateform after 2015. The current usage metrics is available 48-96 hours after online publication and is updated daily on week days.
Initial download of the metrics may take a while.