Open Access
Fig. 8
Download original image
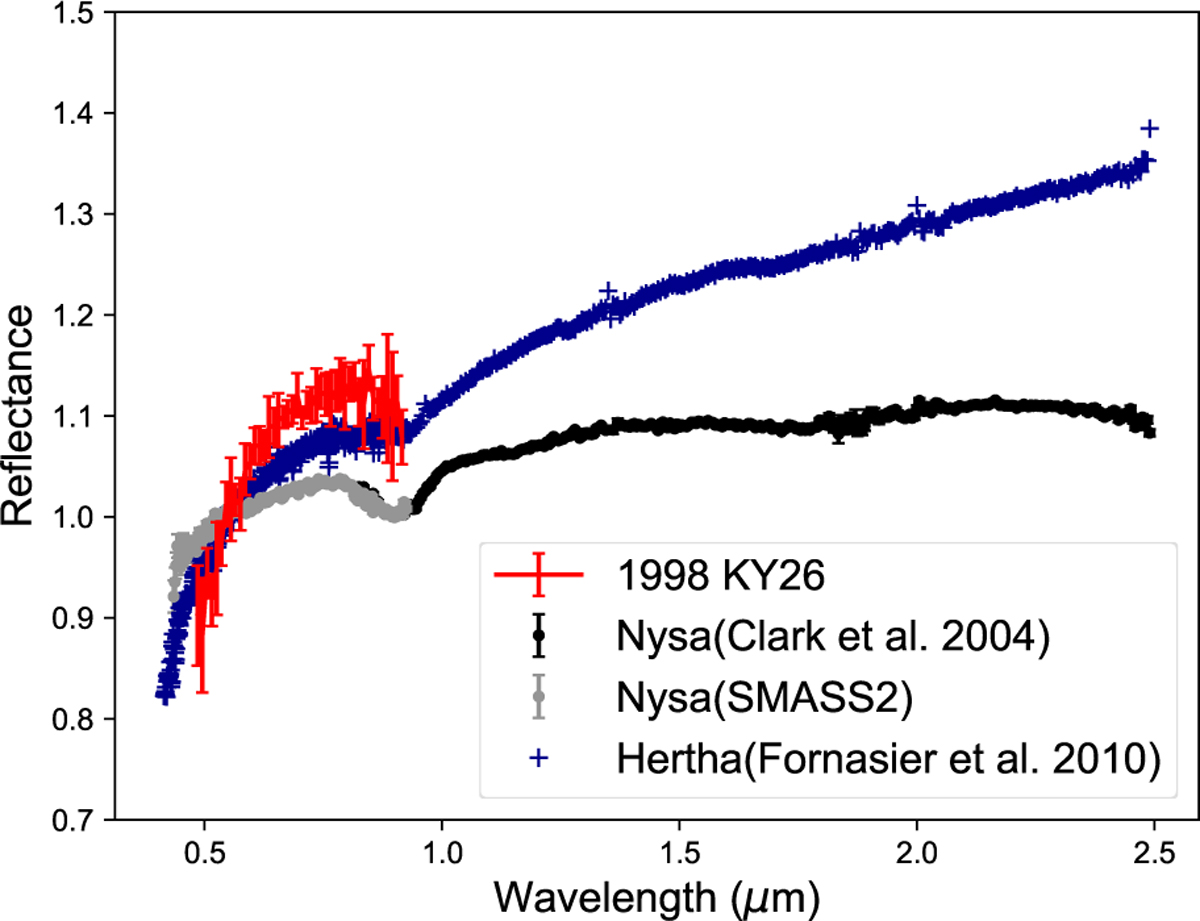
GTC visible reflectance spectrum of 1998 KY26 (red) compared with the visible spectra of (44) Nysa from Bus & Binzel (2002b) (gray), its near-infrared spectrum from Clark et al. (2004) (black), joined using their common wavelength interval of 0.8–0.9 µm, and the spectrum of (135) Hertha from Fornasier et al. (2010) (blue).
Current usage metrics show cumulative count of Article Views (full-text article views including HTML views, PDF and ePub downloads, according to the available data) and Abstracts Views on Vision4Press platform.
Data correspond to usage on the plateform after 2015. The current usage metrics is available 48-96 hours after online publication and is updated daily on week days.
Initial download of the metrics may take a while.