Fig. 10.
Download original image
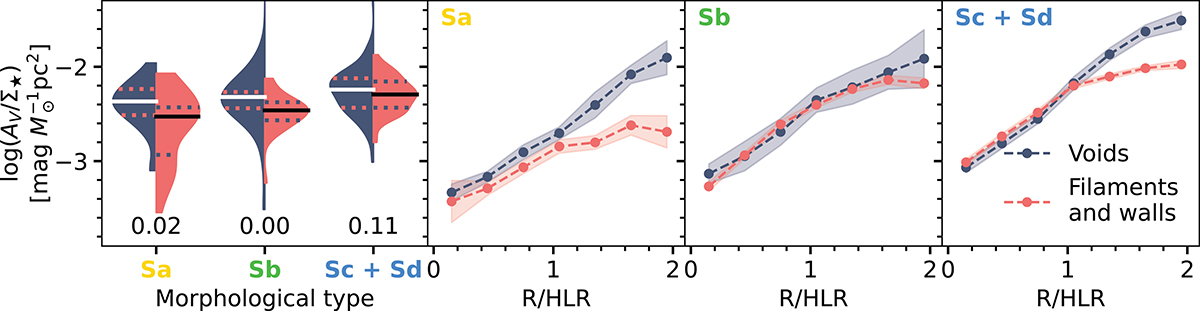
Global values (left) and radial profiles (three right panels) of the AV/Σ★ for the LTGs in voids and in filaments and walls. Each dot represents the median value of the unmasked profiles at each galactocentric distance, and shaded areas around the radial profiles mark the uncertainty (see Fig. 6). The number below each violin plot in the left panel refers to the p value of the K–S test done on the distributions.
Current usage metrics show cumulative count of Article Views (full-text article views including HTML views, PDF and ePub downloads, according to the available data) and Abstracts Views on Vision4Press platform.
Data correspond to usage on the plateform after 2015. The current usage metrics is available 48-96 hours after online publication and is updated daily on week days.
Initial download of the metrics may take a while.