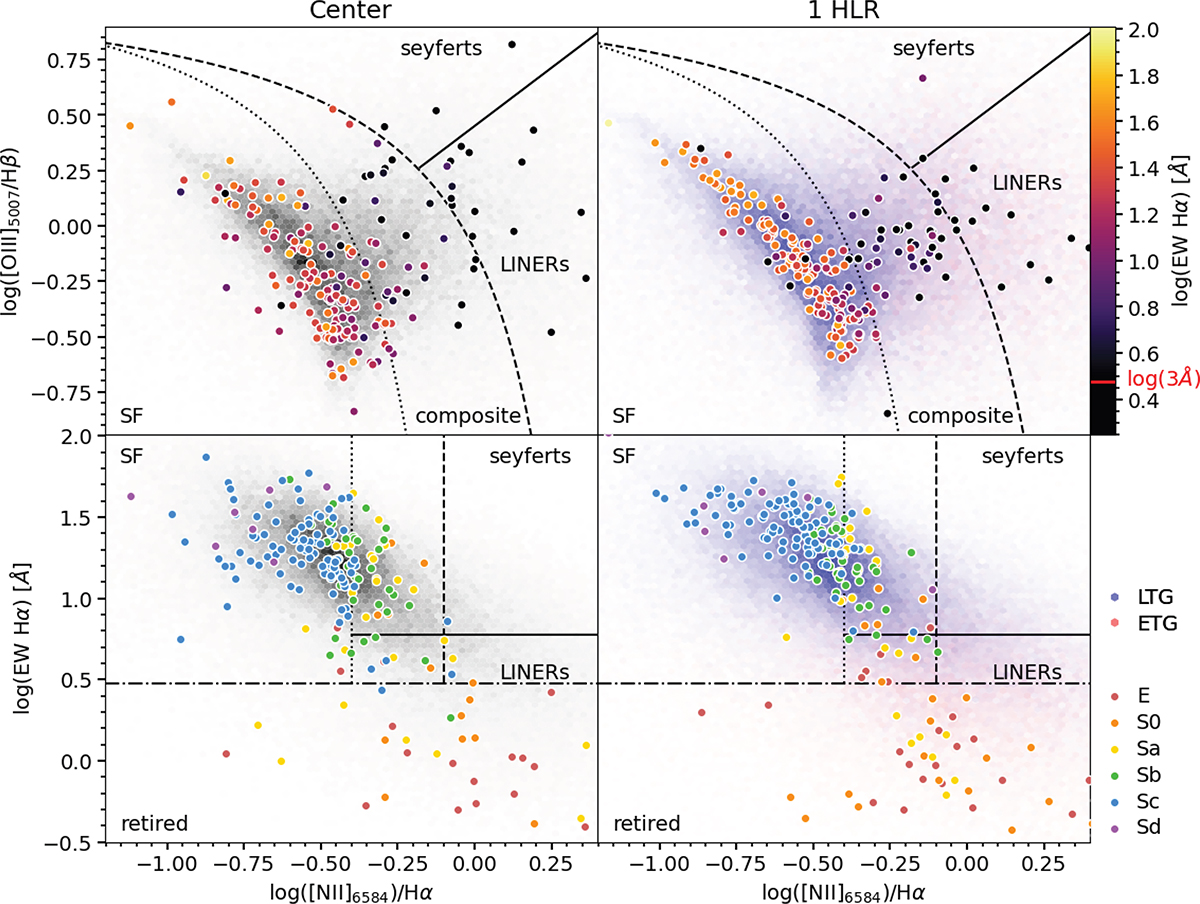
Fig. 4.
Download original image
BPT (top; Baldwin et al. 1981) and WHaN (bottom; Cid Fernandes et al. 2010, 2011) diagnostic diagrams. The dots represent the flux values at the centre (left) or median values at a galactocentric distance of R = 1 HLR (right), coloured by the measurements of EW(Hα) (top) or by morphological type (bottom). The grey shadow on the left shows the distribution of the values of all pixels of all galaxies. On the right, the blue distribution corresponds to the late-type galaxies (LTGs; Sa, Sb, Sc or Sd) and the red to the earl- type galaxies (ETGs; E or S0). The transparency of the colour of both morphological distributions is normalised to the total distribution, as in the panels of the left column. The dotted and dashed lines demarcate the limit between star formation and AGN following the criteria of Kauffmann et al. (2003) and Kewley et al. (2006), respectively. The continuous line differentiates Seyferts from LINERs (Schawinski et al. 2007). The dashed-dotted lines in the two bottom panels mark the retired galaxies (EW(Hα) < 3). Measurements below this limit are coloured black in the top panels.
Current usage metrics show cumulative count of Article Views (full-text article views including HTML views, PDF and ePub downloads, according to the available data) and Abstracts Views on Vision4Press platform.
Data correspond to usage on the plateform after 2015. The current usage metrics is available 48-96 hours after online publication and is updated daily on week days.
Initial download of the metrics may take a while.