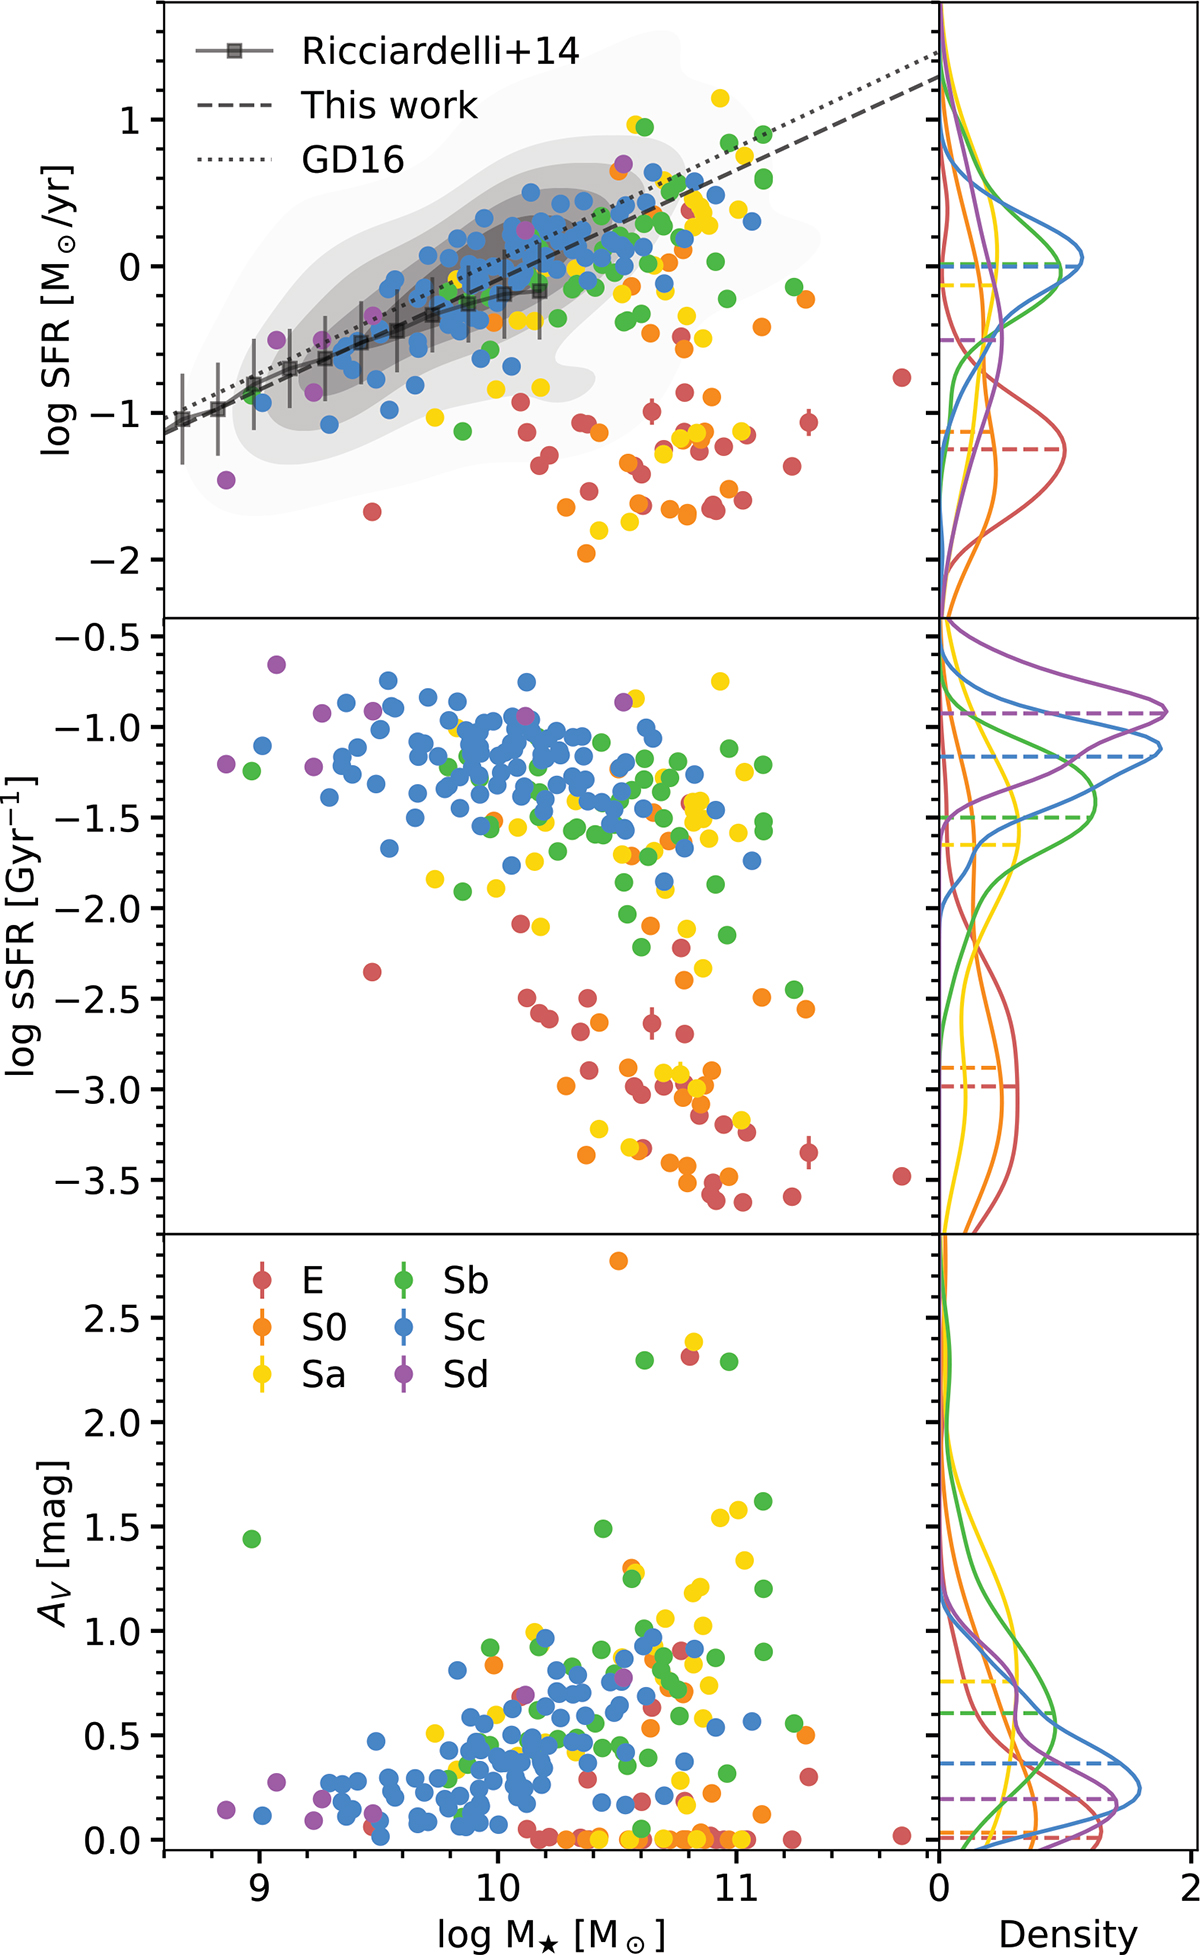
Fig. 5.
Download original image
Global properties coloured by morphological type. Each row shows a different property of each galaxy against their total stellar mass on the left, calculated in Conrado et al. (2024), and the density distribution of each morphological type convolved with a Gaussian kernel on the right, in the y-axis. The straight grey lines in the top left panel show the SFMS calculated by fitting the Sc and Sd galaxies of this work, derived from Hα fluxes (dashed), and of the SFR from stellar population fitting of CALIFA galaxies in González Delgado et al. (2016, dotted). The square dots reference the mean values obtained in Ricciardelli et al. (2014), and the contours behind the dots reference the distribution from Rodríguez et al. (2024); both of these are for galaxies in voids. The horizontal dashed lines in the right panels mark the location of the median of each distribution.
Current usage metrics show cumulative count of Article Views (full-text article views including HTML views, PDF and ePub downloads, according to the available data) and Abstracts Views on Vision4Press platform.
Data correspond to usage on the plateform after 2015. The current usage metrics is available 48-96 hours after online publication and is updated daily on week days.
Initial download of the metrics may take a while.