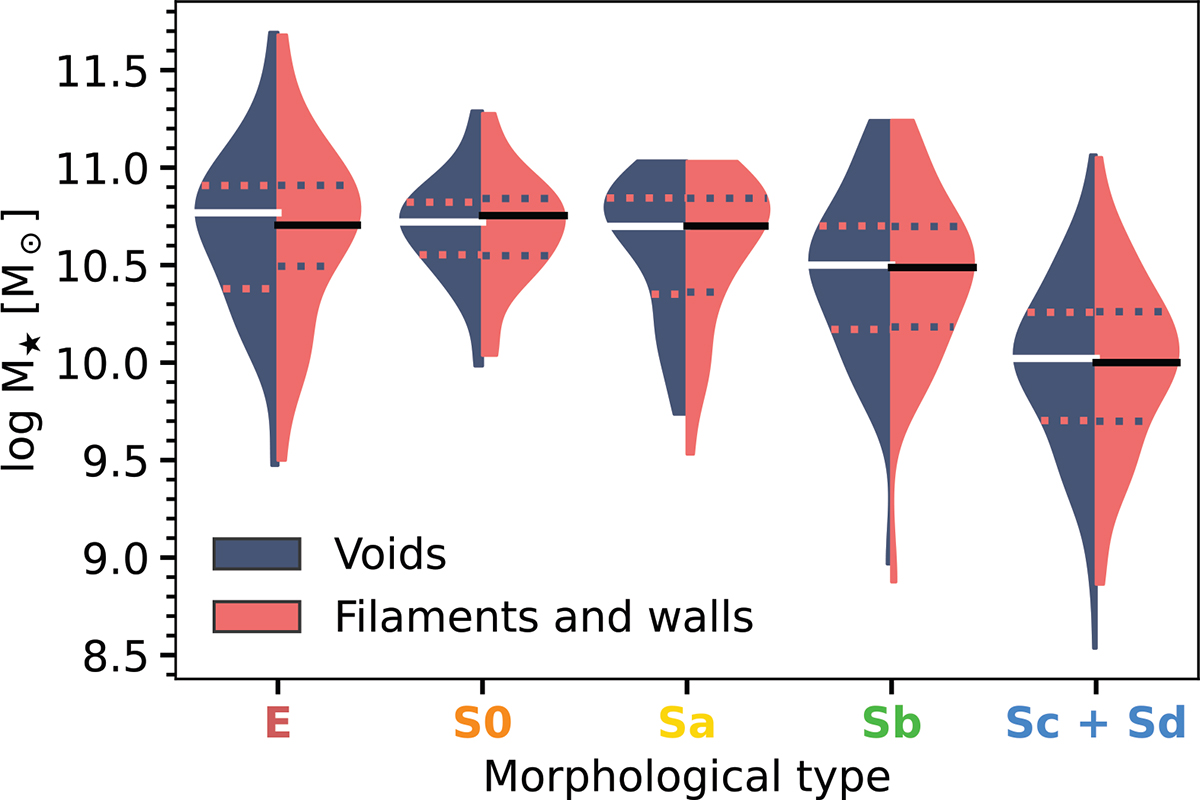
Fig. 7.
Download original image
Distribution of total stellar mass by morphological types, for CAVITY void galaxies (in dark blue) and for CALIFA galaxies in filament or walls, matched in morphological type and total stellar mass (in red). The black and white lines mark the locations of the median of each distribution, and the dotted lines their first and third quartiles. The edges of the distributions are cut to show the minimum and maximum values.
Current usage metrics show cumulative count of Article Views (full-text article views including HTML views, PDF and ePub downloads, according to the available data) and Abstracts Views on Vision4Press platform.
Data correspond to usage on the plateform after 2015. The current usage metrics is available 48-96 hours after online publication and is updated daily on week days.
Initial download of the metrics may take a while.