Open Access
Fig. 8.
Download original image
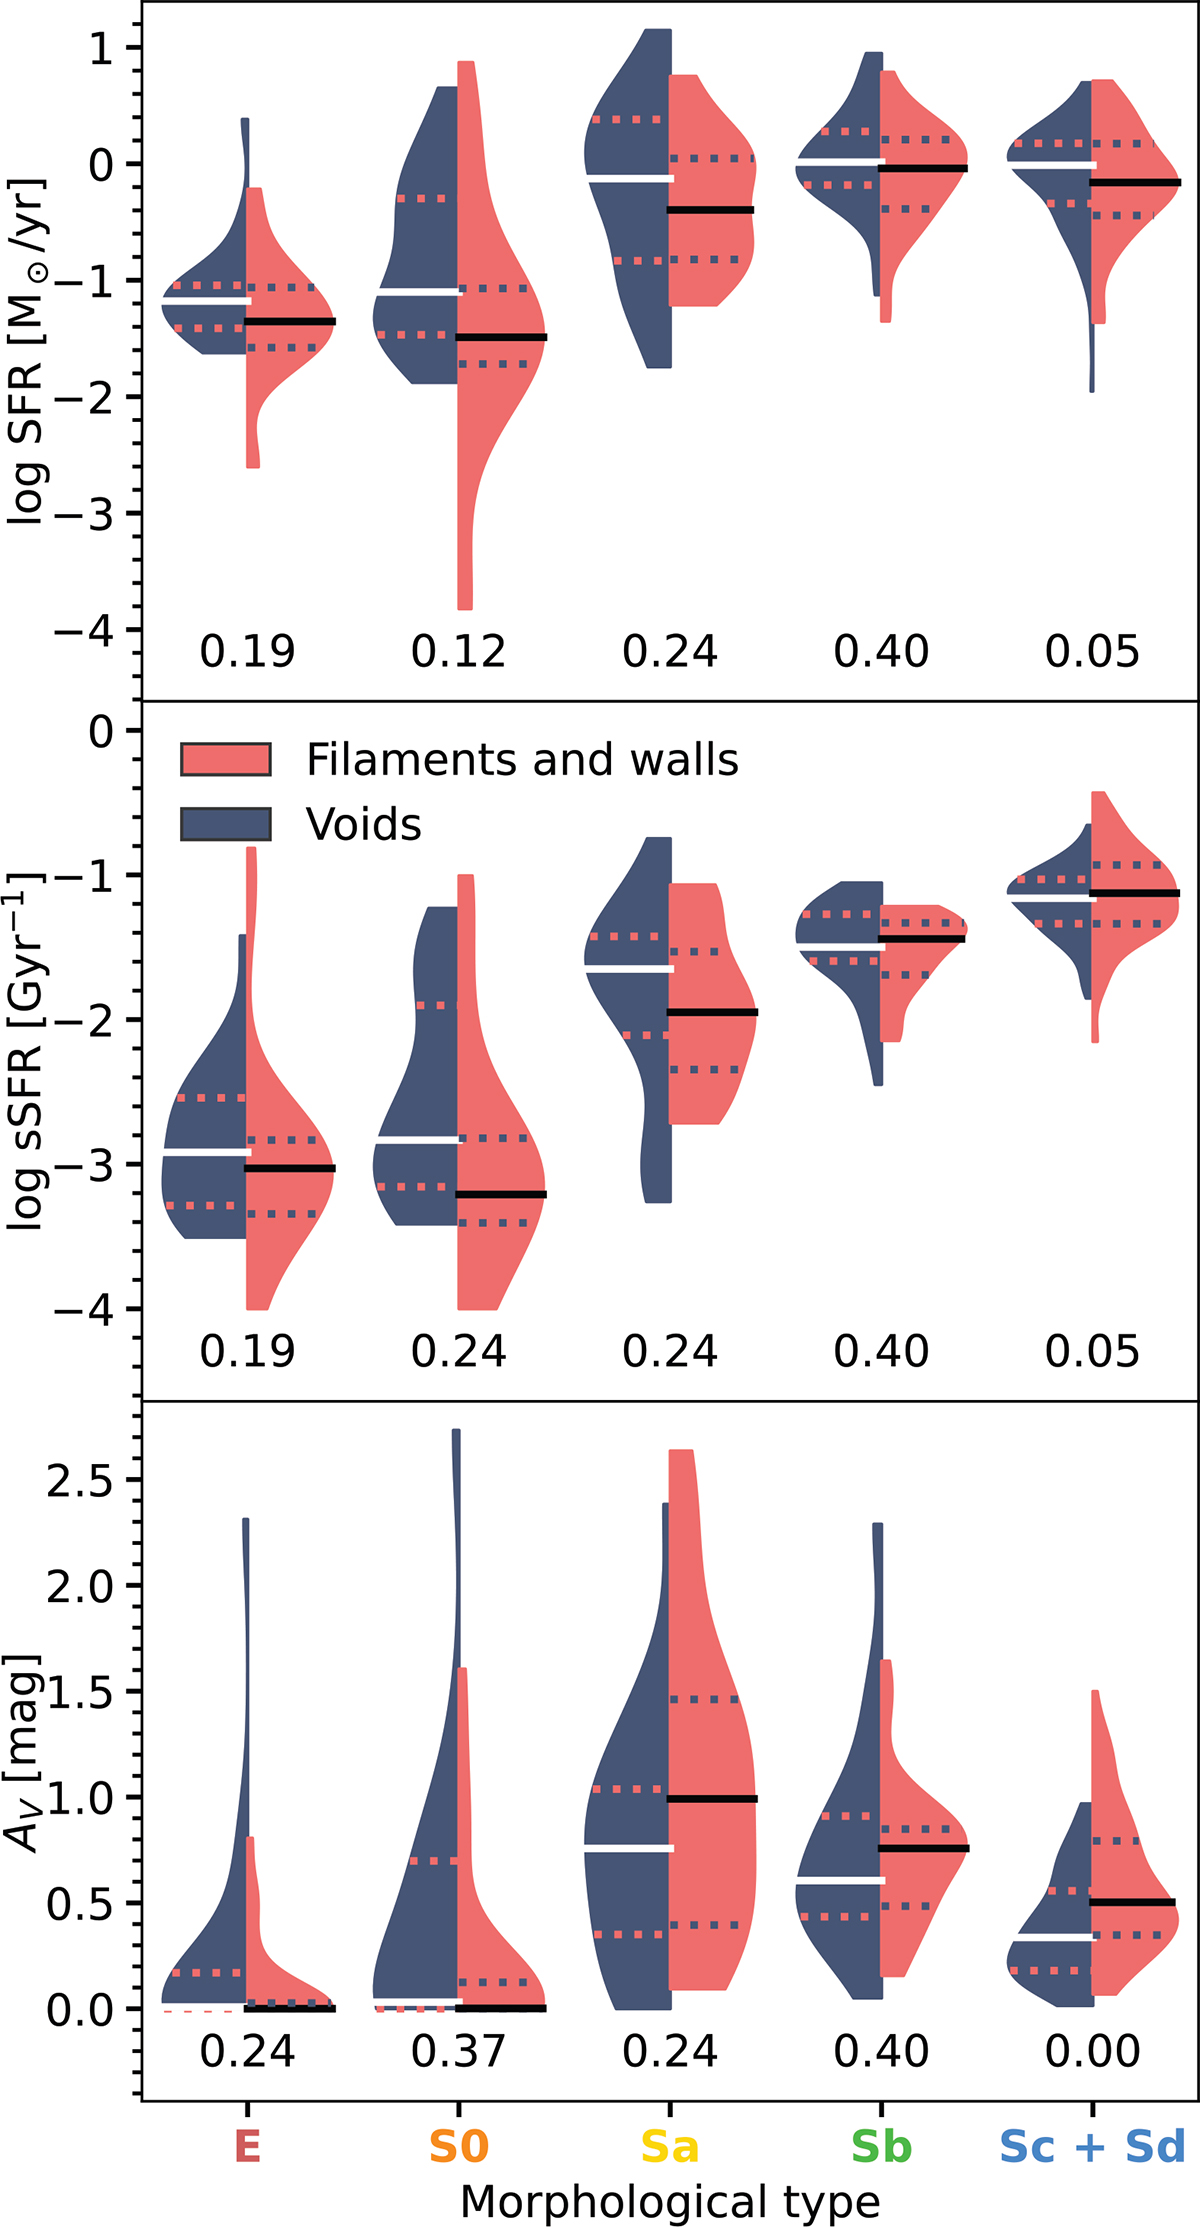
Violin plots of the distributions of the global properties for void galaxies (in dark blue) and filament and wall galaxies (in red). From top to bottom, SFR, sSFR, and AV. See Fig. 7 for details. The numbers below every pair of distributions correspond to the p value of the K–S test performed on them.
Current usage metrics show cumulative count of Article Views (full-text article views including HTML views, PDF and ePub downloads, according to the available data) and Abstracts Views on Vision4Press platform.
Data correspond to usage on the plateform after 2015. The current usage metrics is available 48-96 hours after online publication and is updated daily on week days.
Initial download of the metrics may take a while.