Fig. 3
Download original image
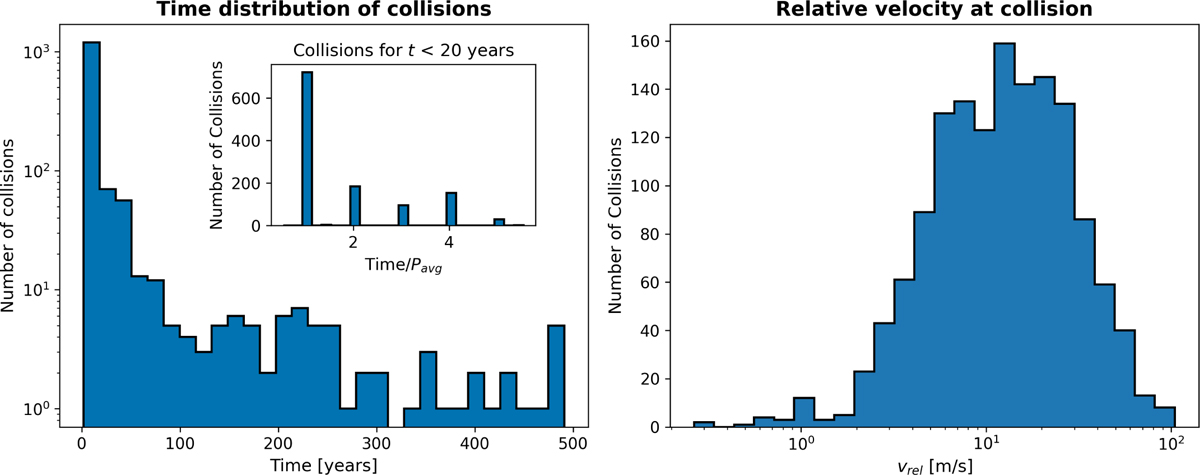
Details of the collisions recorded during the integration of a system of 25 000 particles, each with a radius of 50 km. Left panel: temporal distribution of collisions. The inset provides a close-up of the first twenty years of the integration. In this panel, collision times are normalized to the average orbital period of the fragments, Pavg, showing that impacts preferentially occur at multiples of this period. Right panel: distribution of impact velocities between the fragments.
Current usage metrics show cumulative count of Article Views (full-text article views including HTML views, PDF and ePub downloads, according to the available data) and Abstracts Views on Vision4Press platform.
Data correspond to usage on the plateform after 2015. The current usage metrics is available 48-96 hours after online publication and is updated daily on week days.
Initial download of the metrics may take a while.