Fig. 7
Download original image
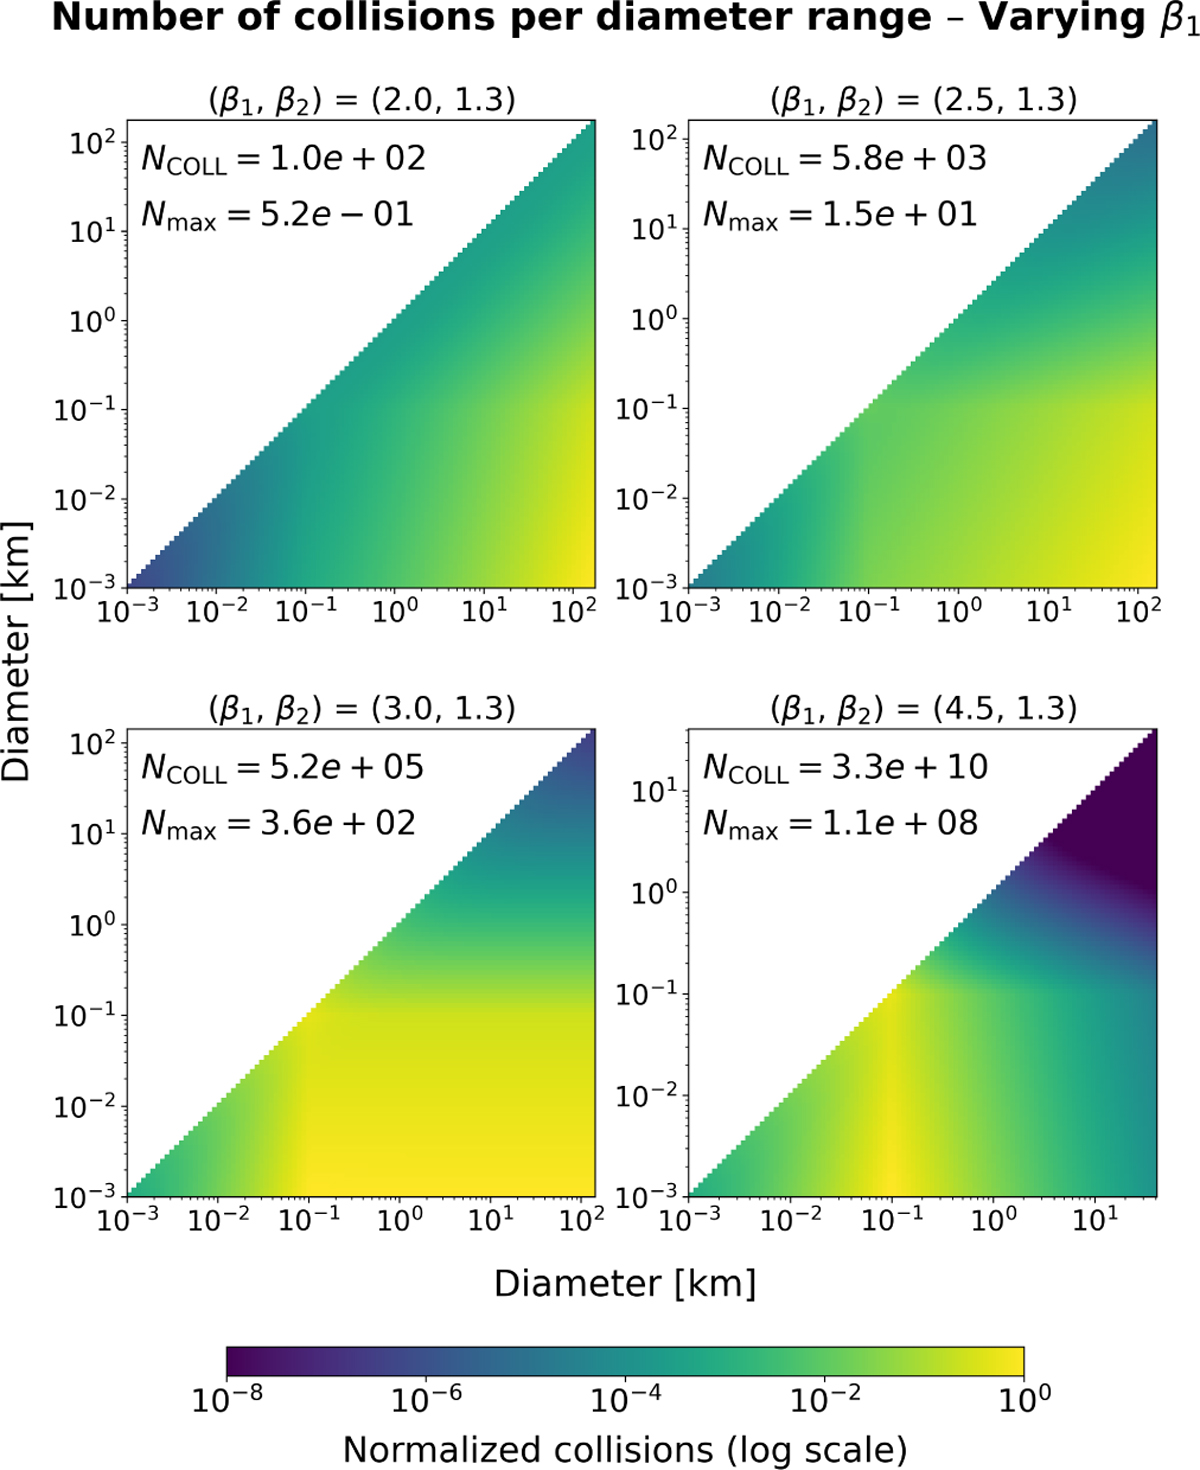
Collisions per diameter range for four size distributions, varying β1. Each panel reports the corresponding size distribution exponents and the total number of collisions NCOLL in that distribution. Colors indicate the logarithm of the fraction of the panel maximum, with absolute maxima NMAX annotated in each panel. The absolute number of collisions can be recovered by multiplying the panel maximum by the value corresponding to a given color. Diameter bins were generated using 100 logarithmically spaced steps between rmin and RLR for each distribution.
Current usage metrics show cumulative count of Article Views (full-text article views including HTML views, PDF and ePub downloads, according to the available data) and Abstracts Views on Vision4Press platform.
Data correspond to usage on the plateform after 2015. The current usage metrics is available 48-96 hours after online publication and is updated daily on week days.
Initial download of the metrics may take a while.