Fig. 2.
Download original image
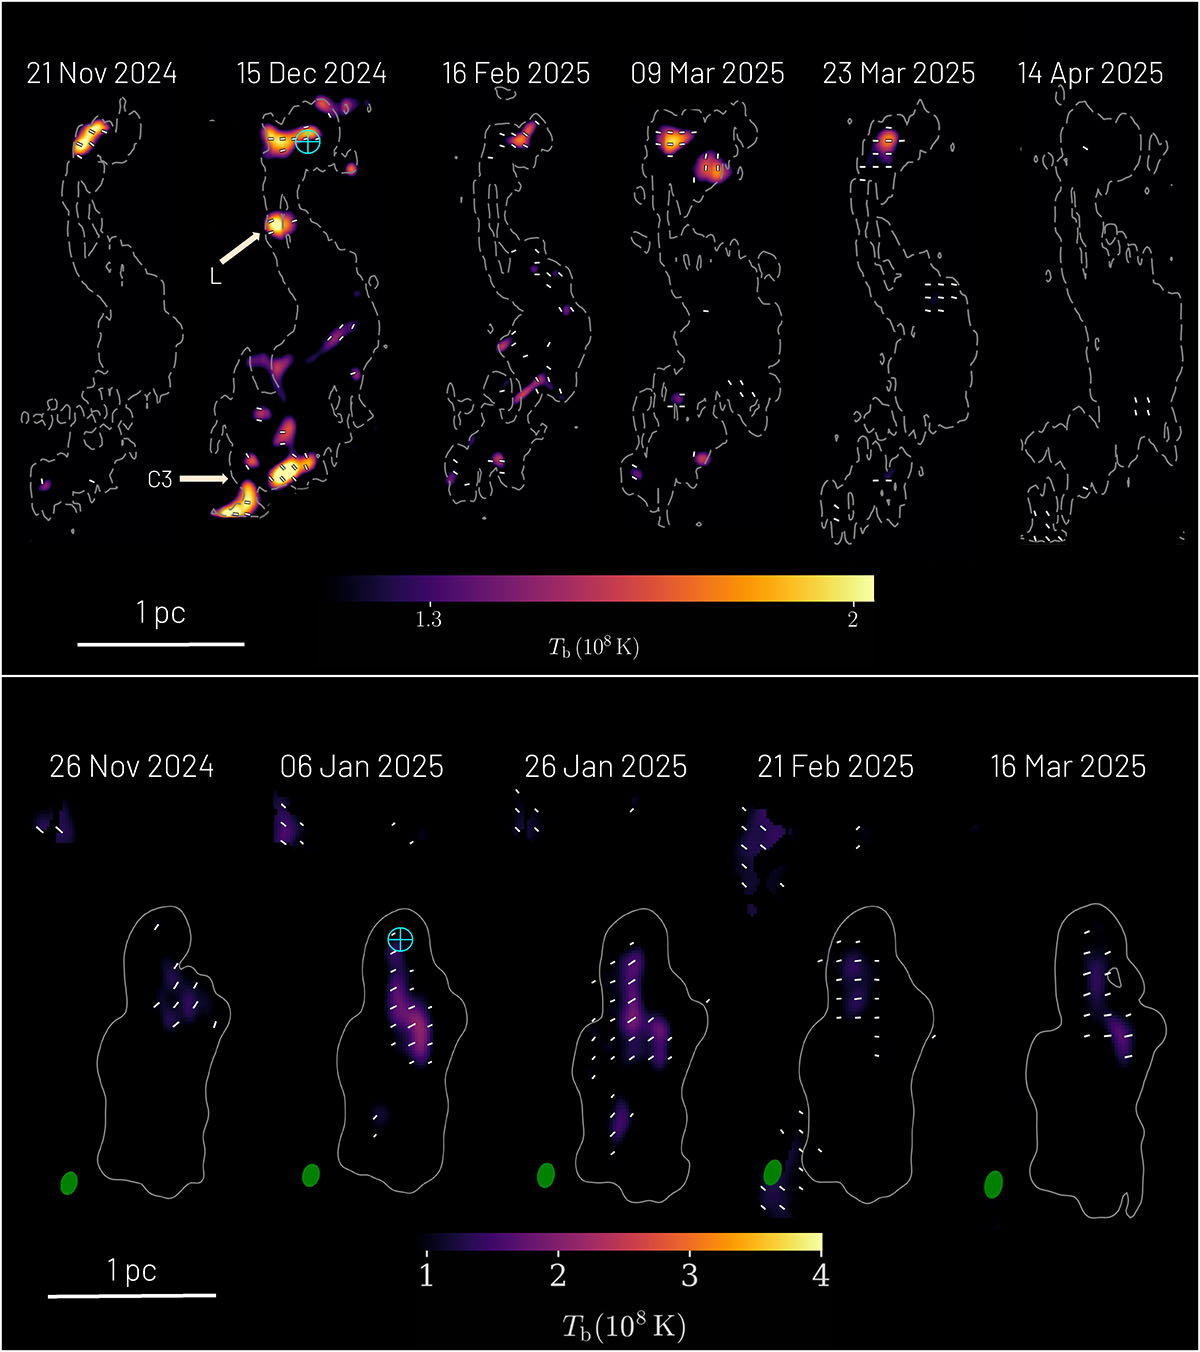
Images of 3C 84 at 43 GHz (BEAM-ME) and 15 GHz (MOJAVE). Top panel: 43 GHz total intensity (contours) and linear polarisation (colour) images of 3C 84 for all available epochs during the time frame of interest. The contour levels were set at 1% of the total intensity maximum (Imax) per epoch. The linear polarisation flux density is displayed in units of brightness temperature. The chosen colour scale is meant to display the detections while also masking the surrounding noise. The cyan cross and circle denote the core region and the arrows show C3, as discussed in the main text, and region L (see discussion in Sect. 3). The white sticks indicate the EVPAs. At the epoch nearest to the γ-ray flare peak (15 Dec. 2024), we detect linear polarisation at a distance of ∼1.5 parsec (C3) from the central engine. Bottom panel: 15 GHz images of the 3C 84 jet for the available epochs in the time frame of interest, shown in a similar manner as in the top panel, prepared by the MOJAVE collaboration (CLEAN-reconstruction). The green ellipse next to each reconstruction illustrates the restoring CLEAN-beam, which corresponds to (0.8 × 0.5) mas (15° ) on average. We note that the linear polarisation is similar in magnitude to the noise level, amounting to marginal detections.
Current usage metrics show cumulative count of Article Views (full-text article views including HTML views, PDF and ePub downloads, according to the available data) and Abstracts Views on Vision4Press platform.
Data correspond to usage on the plateform after 2015. The current usage metrics is available 48-96 hours after online publication and is updated daily on week days.
Initial download of the metrics may take a while.