Open Access
Fig. B.1.
Download original image
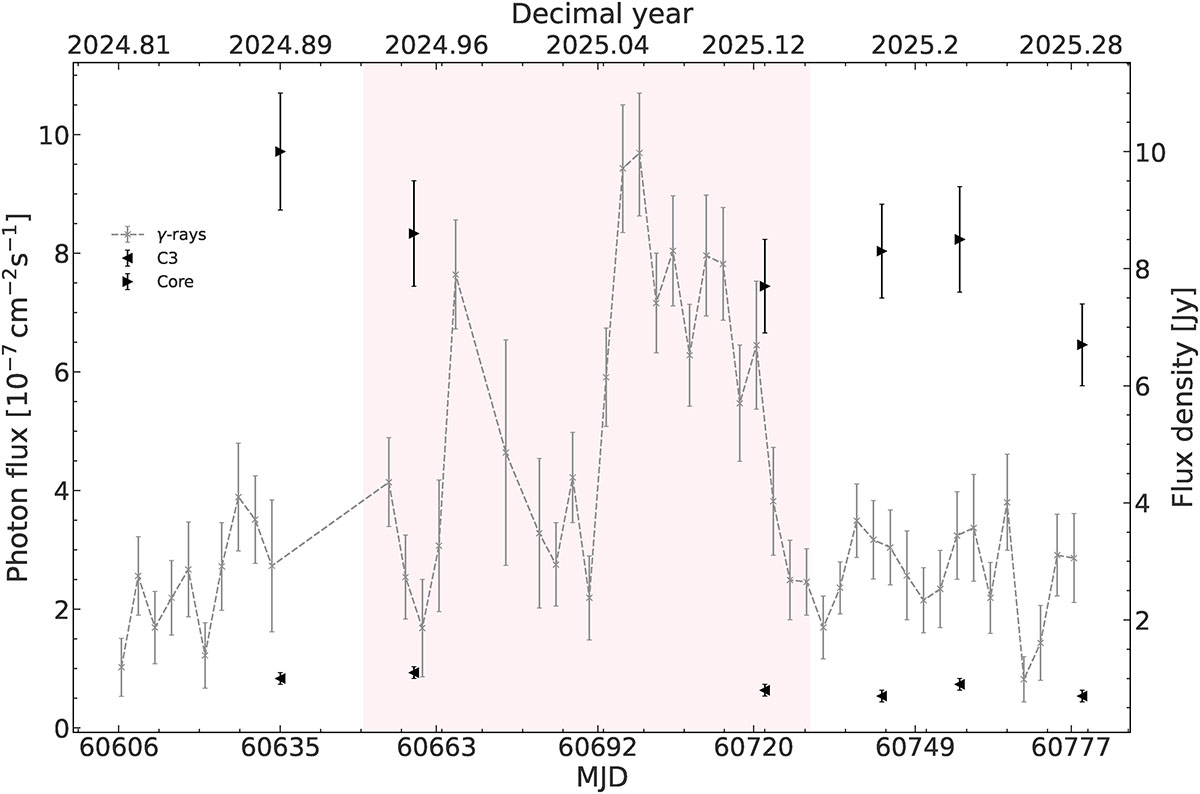
Total intensity flux density light curve of the core and C3 region, displayed along the γ-ray light curve. The setup of the figure is similar to Fig. 1. While the core flux density remains stable during the γ-ray flare, the one of the C3 region is higher, following the same trend as the polarisation degree.
Current usage metrics show cumulative count of Article Views (full-text article views including HTML views, PDF and ePub downloads, according to the available data) and Abstracts Views on Vision4Press platform.
Data correspond to usage on the plateform after 2015. The current usage metrics is available 48-96 hours after online publication and is updated daily on week days.
Initial download of the metrics may take a while.