Fig. 12
Download original image
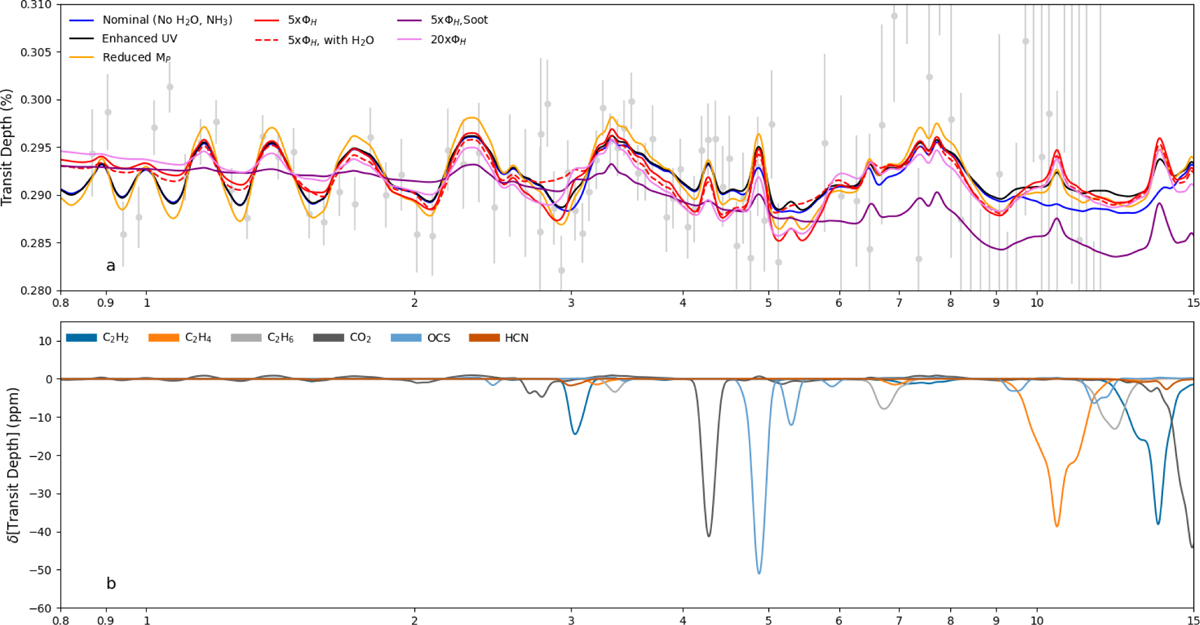
Sensitivity tests on the transit spectrum. Panel a compares the nominal spectrum for the 200×solar metallicity case and Tint = 60 K case (blue line) with different scenarios discussed in the text and related to the planet mass, the haze mass flux and its optical properties. Panel b presents the differential transit signature of different gases for the enhanced UV scenario.
Current usage metrics show cumulative count of Article Views (full-text article views including HTML views, PDF and ePub downloads, according to the available data) and Abstracts Views on Vision4Press platform.
Data correspond to usage on the plateform after 2015. The current usage metrics is available 48-96 hours after online publication and is updated daily on week days.
Initial download of the metrics may take a while.