Fig. 3
Download original image
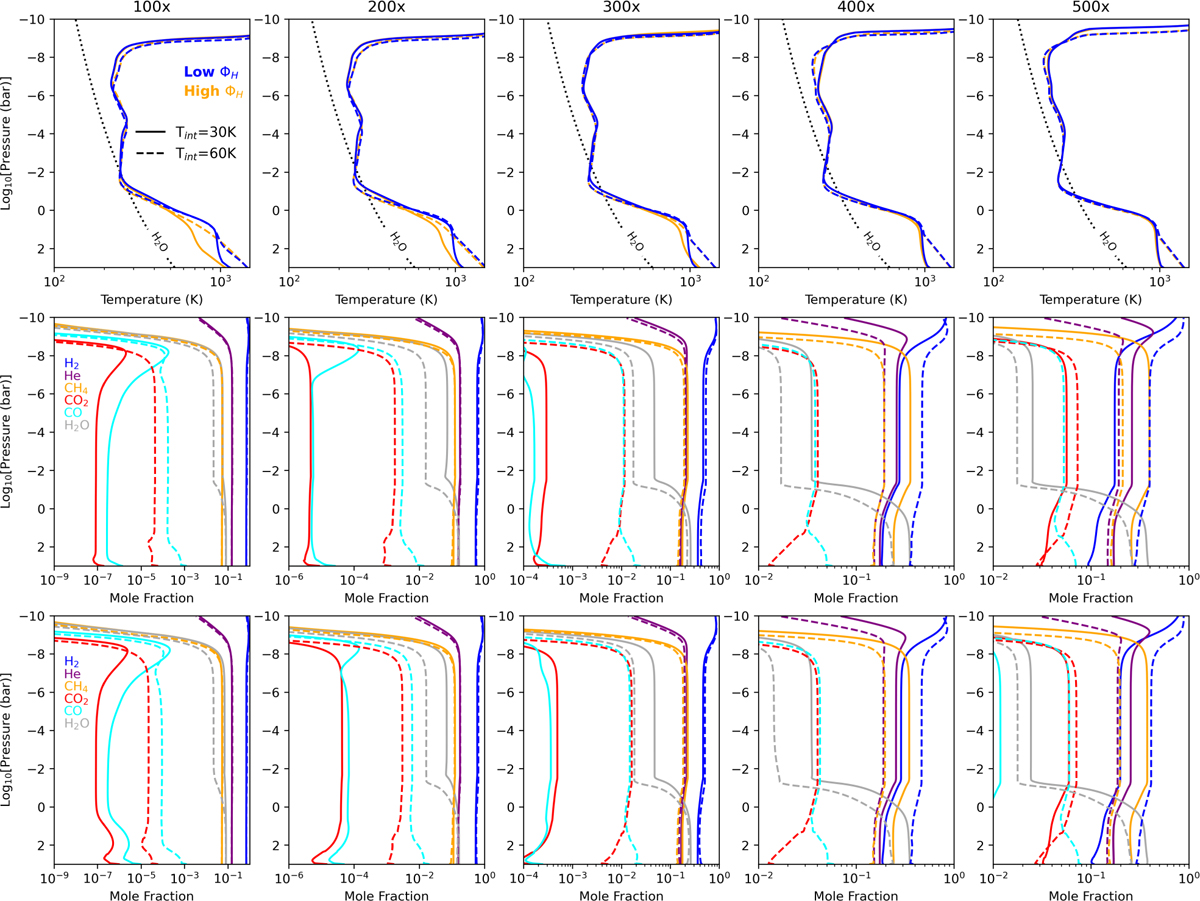
Thermal structure (top row) for the different metallicity cases considered. Blue (orange) lines correspond to the low (high) photochemical haze mass flux scenario, while solid and dashed lines correspond to the Tint = 30 and 60 K cases, respectively. The middle (high ΦH) and lower (low ΦH) panels present the corresponding disequilibrium composition for the high (solid) and low (dashed) Tint cases, respectively.
Current usage metrics show cumulative count of Article Views (full-text article views including HTML views, PDF and ePub downloads, according to the available data) and Abstracts Views on Vision4Press platform.
Data correspond to usage on the plateform after 2015. The current usage metrics is available 48-96 hours after online publication and is updated daily on week days.
Initial download of the metrics may take a while.