Fig. 6
Download original image
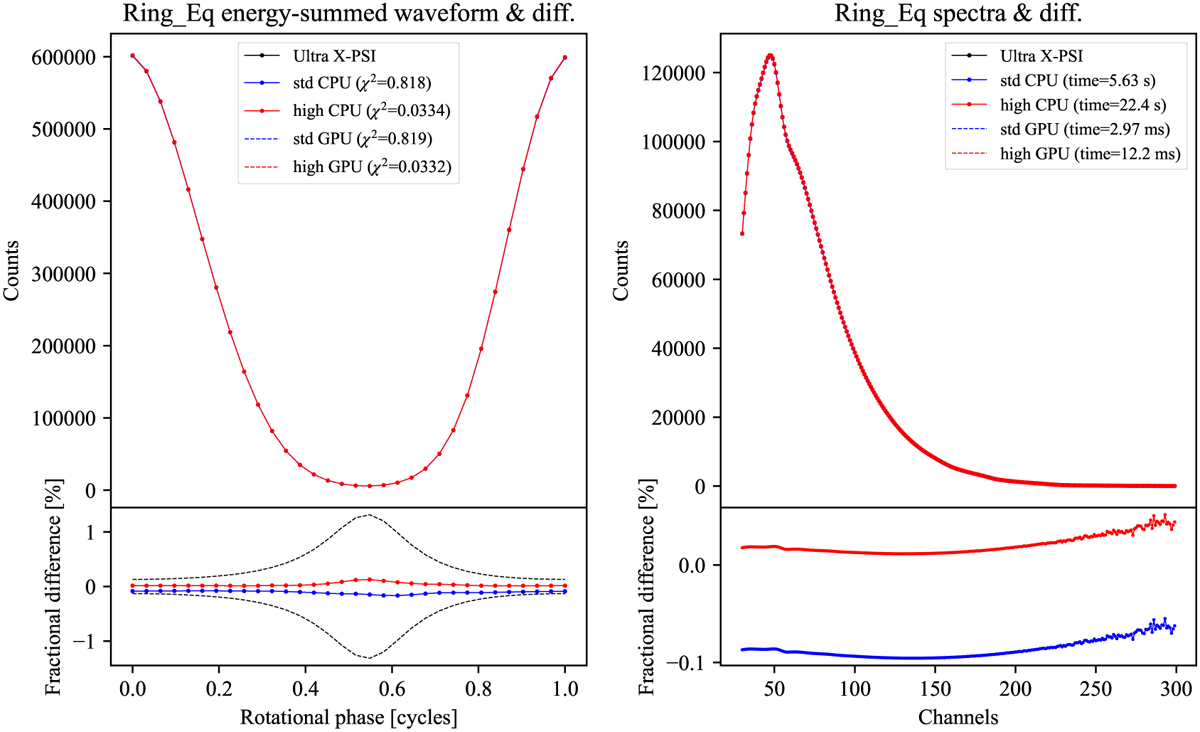
Energy-summed waveforms (left) and phase-summed spectra (right) for the Ring-Eq case. The bottom subpanels show the fractional difference (in %) of each configuration relative to the X-PSI Ultra-resolution benchmark (black dotted). CPU results are plotted with solid lines: standard resolution (blue solid) and high resolution (red solid). GPU results are plotted with dashed lines: standard resolution (blue dashed) and high resolution (red dashed). In the left panel, the legend reports χ2 as defined in Equation (57), computed jointly over energy and phase channels as a quantitative measure of the discrepancy between full energy-resolved pulse profile. In the right panel, the legend lists the runtime for each configuration. Gray dashed lines in the bottom subpanels indicate the expected Poisson fluctuations of the Ultra-resolution X-PSI benchmark.
Current usage metrics show cumulative count of Article Views (full-text article views including HTML views, PDF and ePub downloads, according to the available data) and Abstracts Views on Vision4Press platform.
Data correspond to usage on the plateform after 2015. The current usage metrics is available 48-96 hours after online publication and is updated daily on week days.
Initial download of the metrics may take a while.