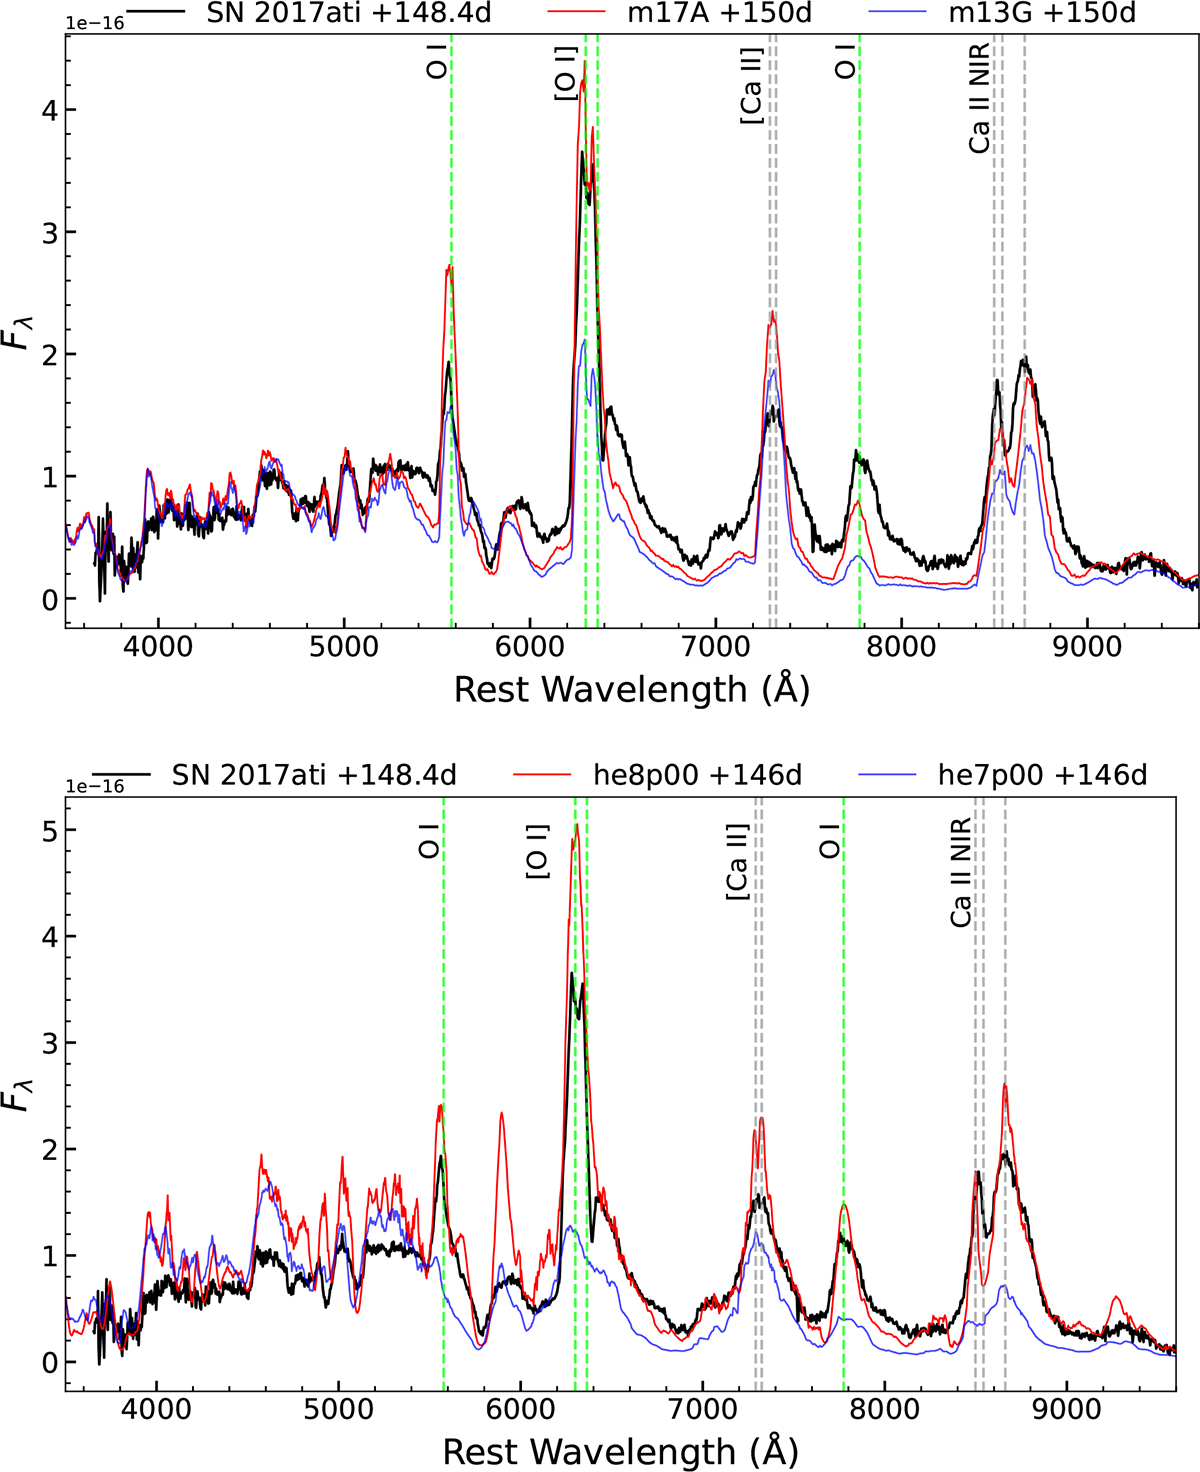
Fig. 10.
Download original image
Nebular-phase spectrum of SN 2017ati at +148.4 d post-explosion (black line), compared with synthetic spectra from different progenitor models. Upper panel: comparison with Type IIb SN models from Jerkstrand et al. (2015a). The blue line represents a model with a progenitor MZAMS = 13 M⊙, while the red line represents a model with MZAMS = 17 M⊙. Lower panel: comparison with the he7p00 and he8p00 models presented by Dessart et al. (2023). The blue line denotes the he7p00 model with MpreSN = 5.04 M⊙, while the red line corresponds to the he8p00 model with MpreSN = 5.63 M⊙. In both panels, the model spectra are scaled to the same distance and the same 56Ni mass as SN 2017ati.
Current usage metrics show cumulative count of Article Views (full-text article views including HTML views, PDF and ePub downloads, according to the available data) and Abstracts Views on Vision4Press platform.
Data correspond to usage on the plateform after 2015. The current usage metrics is available 48-96 hours after online publication and is updated daily on week days.
Initial download of the metrics may take a while.