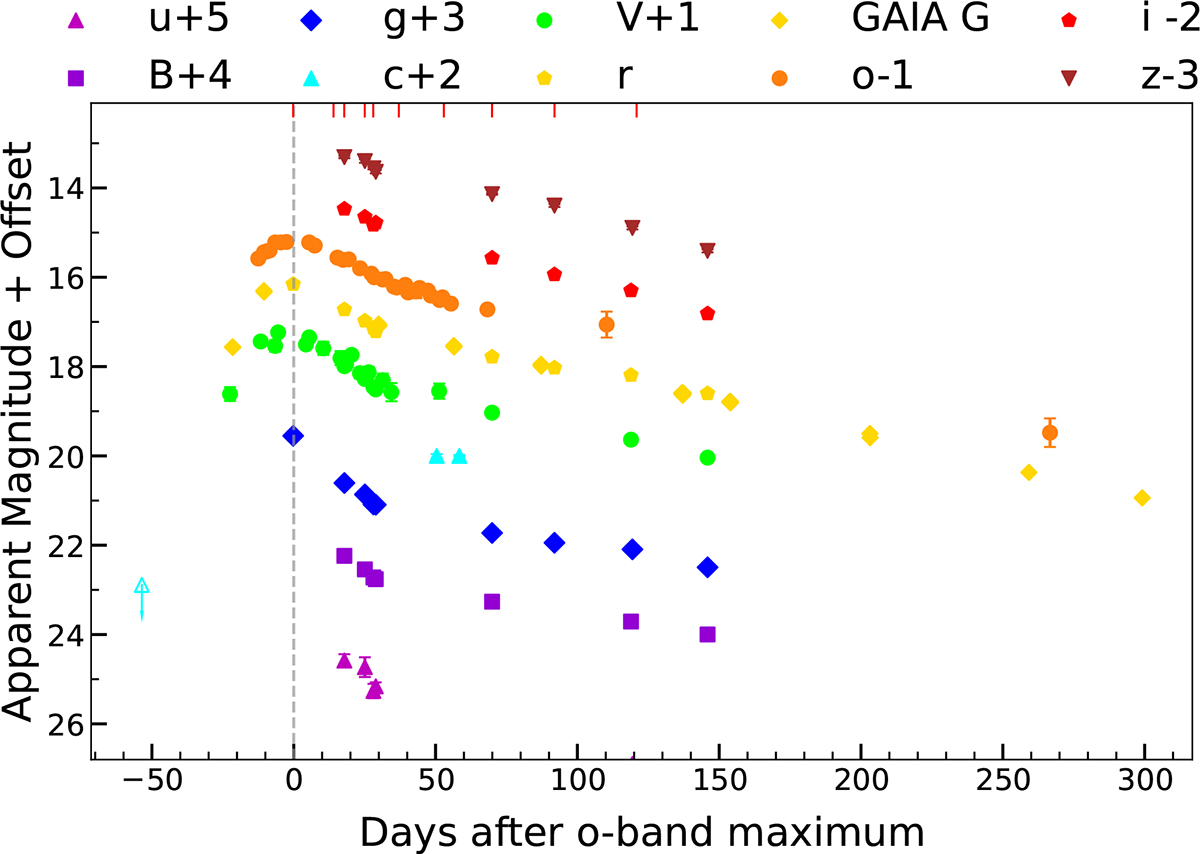
Fig. C.2.
Download original image
Multi-band light curves of SN 2017ati. The dashed vertical line marks the reference epoch, corresponding to the maximum light in the o band. Epochs of our spectroscopic observations are indicated by solid red vertical lines at the top. Upper limits are represented by empty symbols with downward arrows. For clarity, the light curves have been vertically offset by constant values, as indicated in the legend. In most cases, the magnitude uncertainties are smaller than the sizes of the plotted symbols.
Current usage metrics show cumulative count of Article Views (full-text article views including HTML views, PDF and ePub downloads, according to the available data) and Abstracts Views on Vision4Press platform.
Data correspond to usage on the plateform after 2015. The current usage metrics is available 48-96 hours after online publication and is updated daily on week days.
Initial download of the metrics may take a while.