Open Access
Fig. C.4.
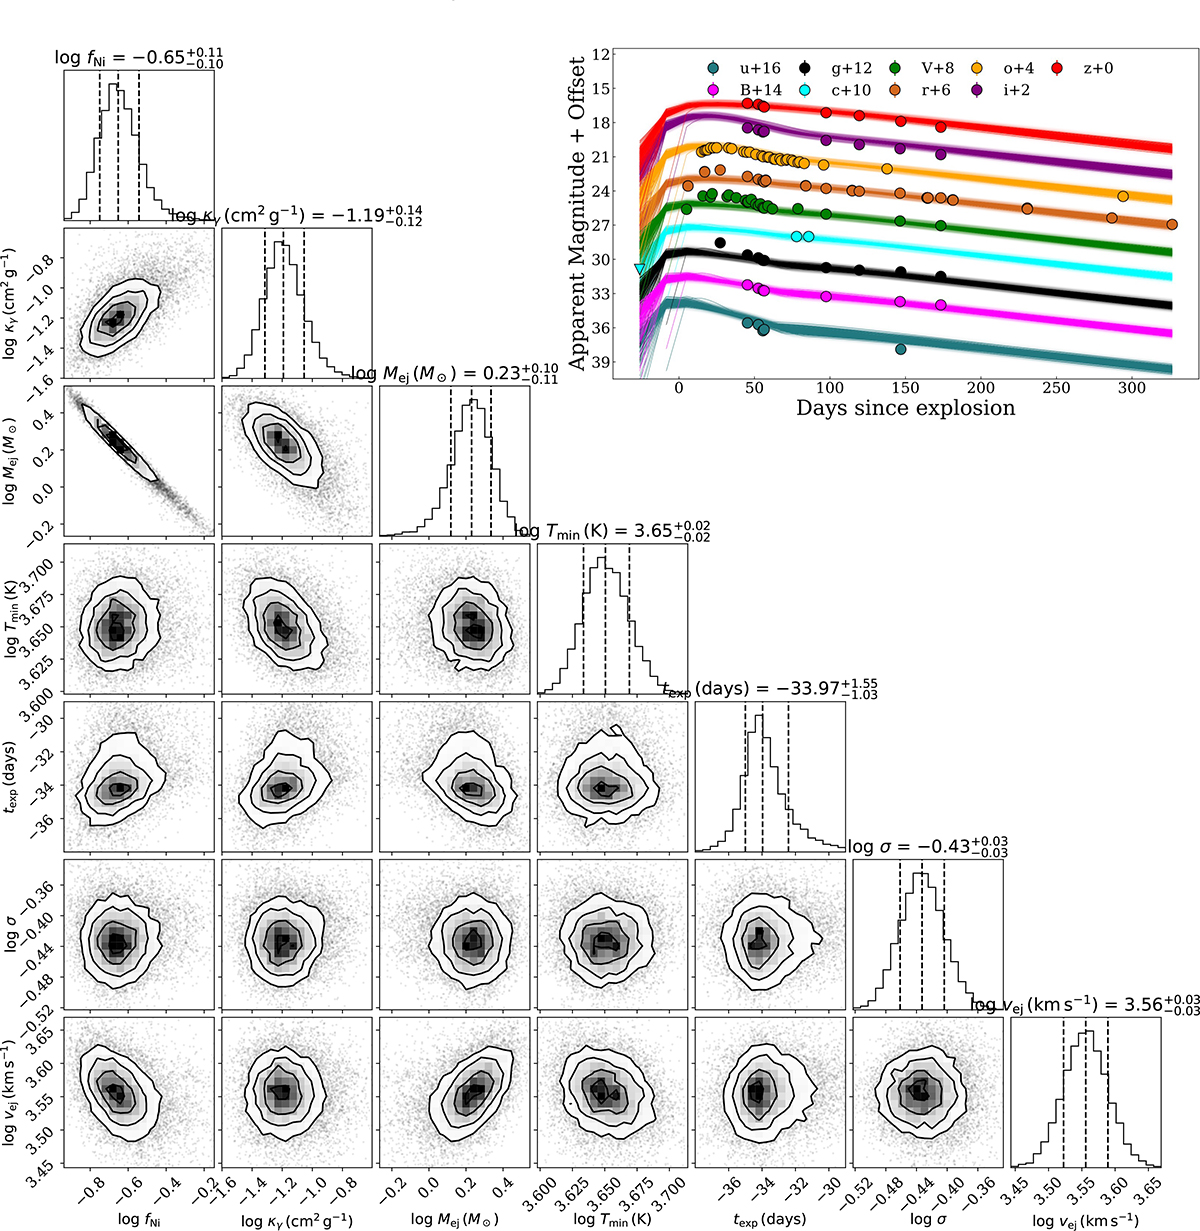
Download original image
Multi-band light curve of SN 2017ati fitted with the radioactive decay model by MOSFiT, together with the parameter posteriors from the MCMC sampling displayed in the corner plot. The relevant parameters are listed in Table B.4.
Current usage metrics show cumulative count of Article Views (full-text article views including HTML views, PDF and ePub downloads, according to the available data) and Abstracts Views on Vision4Press platform.
Data correspond to usage on the plateform after 2015. The current usage metrics is available 48-96 hours after online publication and is updated daily on week days.
Initial download of the metrics may take a while.