Fig. 5.
Download original image
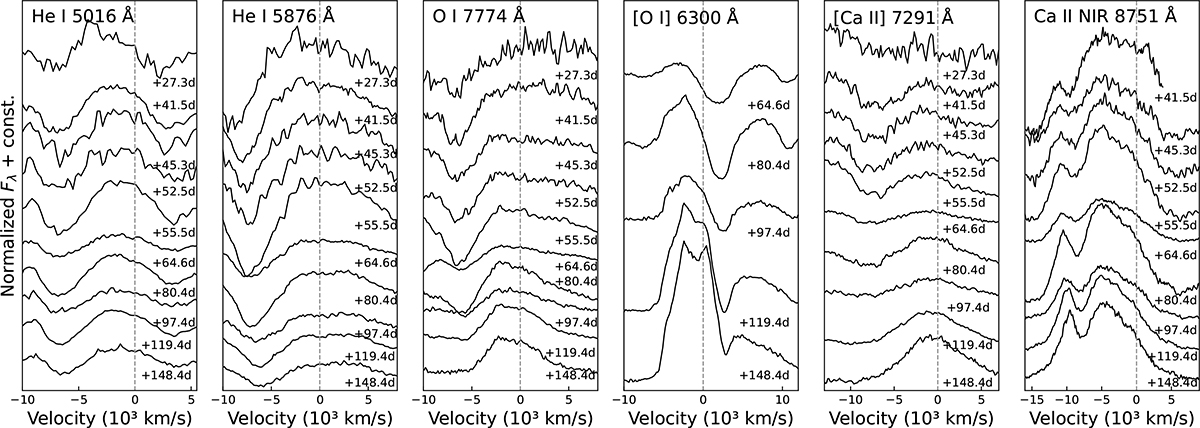
Line profiles of He I, O I, [O I], [Ca II], and Ca II NIR within the spectra of SN 2017ati. The dashed lines indicate the velocities corresponding to the rest wavelengths of the emission lines at λλ5016, 5876, 7774, 6300, 7291, and 8751. The epoch of each spectrum is given in the rest frame, relative to the estimated explosion date.
Current usage metrics show cumulative count of Article Views (full-text article views including HTML views, PDF and ePub downloads, according to the available data) and Abstracts Views on Vision4Press platform.
Data correspond to usage on the plateform after 2015. The current usage metrics is available 48-96 hours after online publication and is updated daily on week days.
Initial download of the metrics may take a while.