Open Access
Fig. 2
Download original image
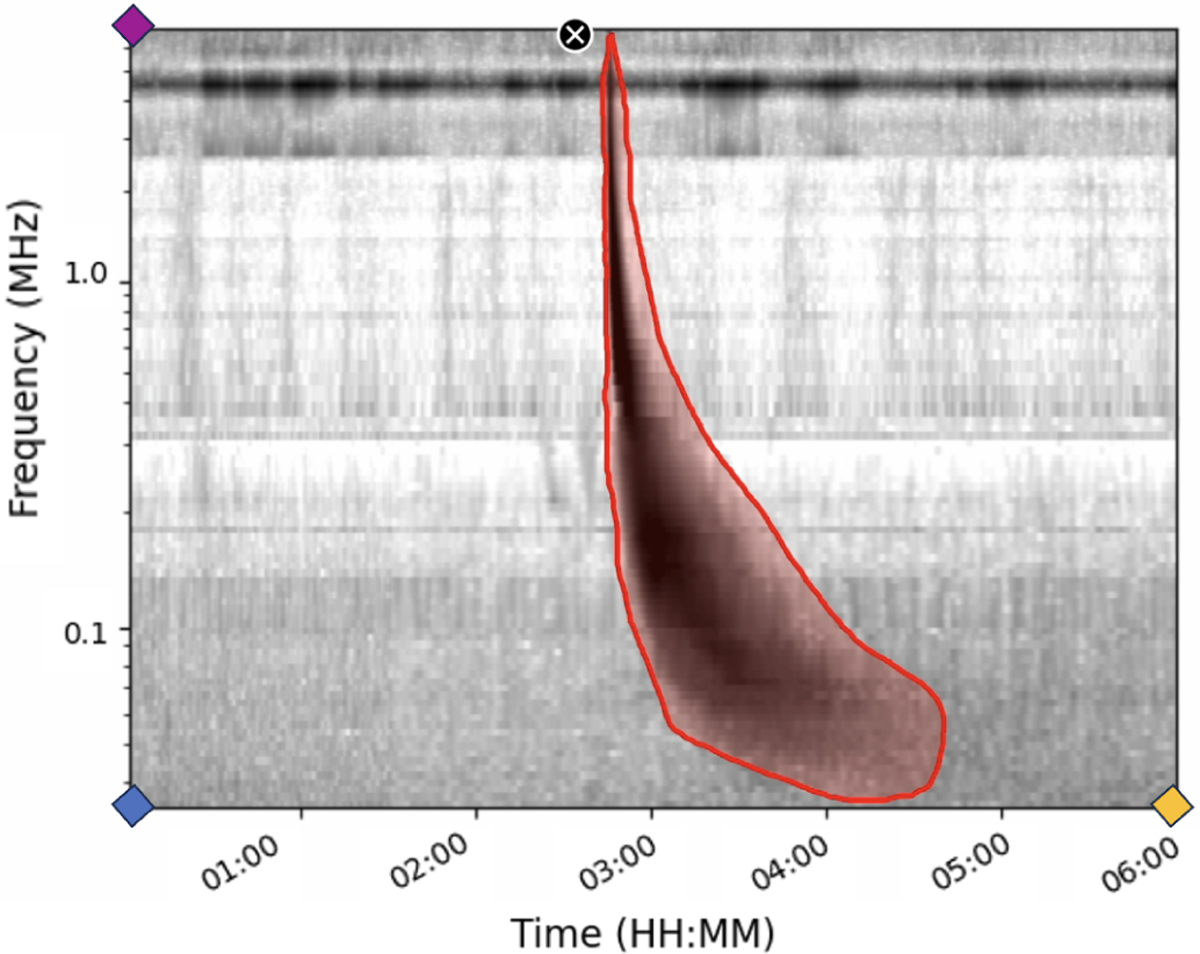
Schematic of the volunteer annotation task, showing how a Type III burst is outlined (red region) and the three anchor points used to convert pixel coordinates to physical time and frequency: origin (blue), maximum time (yellow), and maximum frequency (purple).
Current usage metrics show cumulative count of Article Views (full-text article views including HTML views, PDF and ePub downloads, according to the available data) and Abstracts Views on Vision4Press platform.
Data correspond to usage on the plateform after 2015. The current usage metrics is available 48-96 hours after online publication and is updated daily on week days.
Initial download of the metrics may take a while.