Open Access
Fig. 3
Download original image
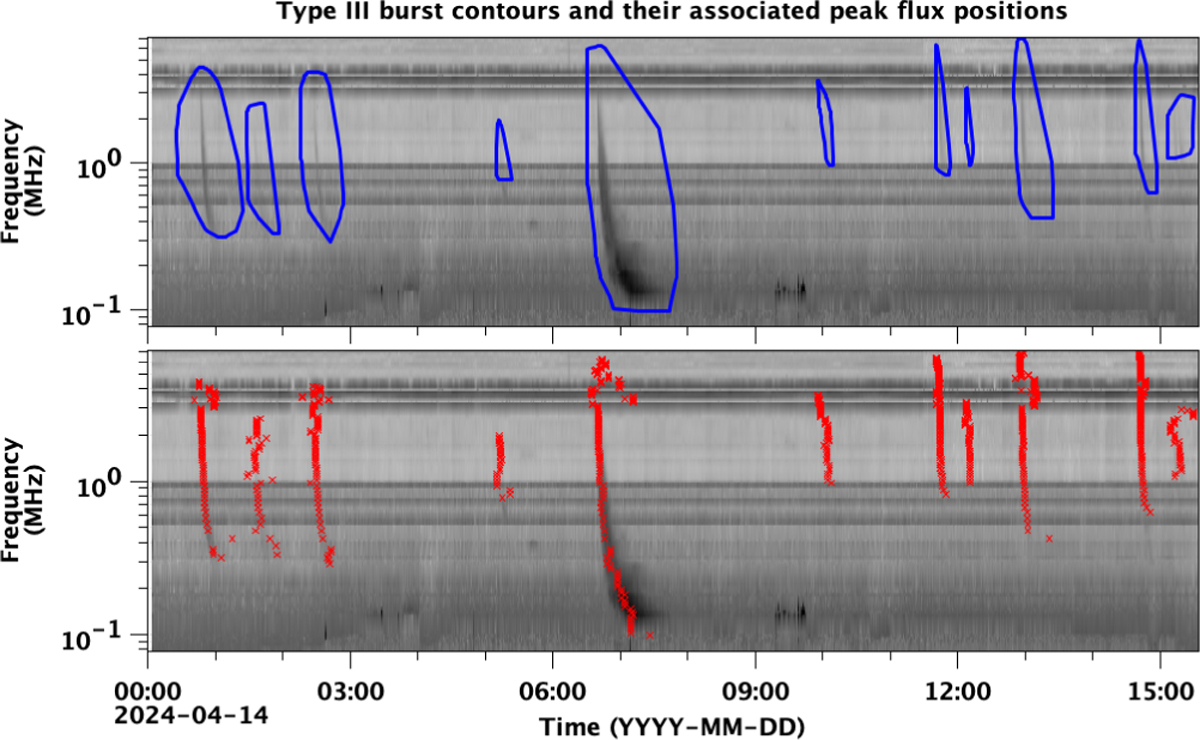
DSs from 14 April 2024 from both the HFR and TNR receivers, showing the peak-flux positions (red crosses) associated with each selected contour (blue outlines).
Current usage metrics show cumulative count of Article Views (full-text article views including HTML views, PDF and ePub downloads, according to the available data) and Abstracts Views on Vision4Press platform.
Data correspond to usage on the plateform after 2015. The current usage metrics is available 48-96 hours after online publication and is updated daily on week days.
Initial download of the metrics may take a while.