Fig. 6
Download original image
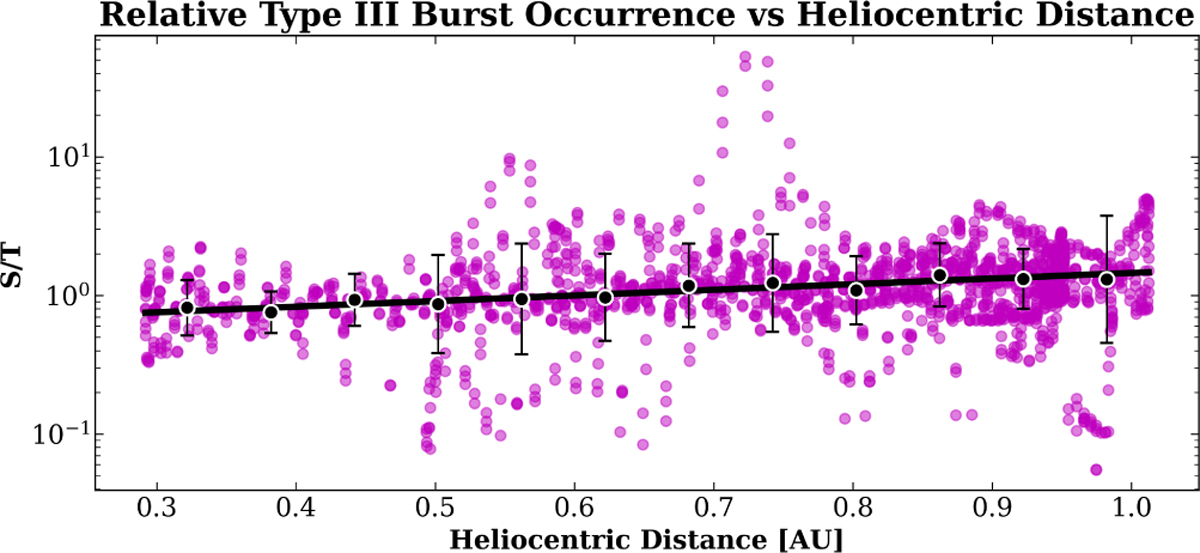
Scatter plot of the daily S/T ratio as a function of the heliocentric distance of Solar Orbiter between 12 February 2020 and 5 March 2025. Black circles show the median S/T values computed in distance bins, while the vertical error bars correspond to the 1σ scatter within each bin. The solid black line indicates a weighted linear fit performed in logarithmic space.
Current usage metrics show cumulative count of Article Views (full-text article views including HTML views, PDF and ePub downloads, according to the available data) and Abstracts Views on Vision4Press platform.
Data correspond to usage on the plateform after 2015. The current usage metrics is available 48-96 hours after online publication and is updated daily on week days.
Initial download of the metrics may take a while.