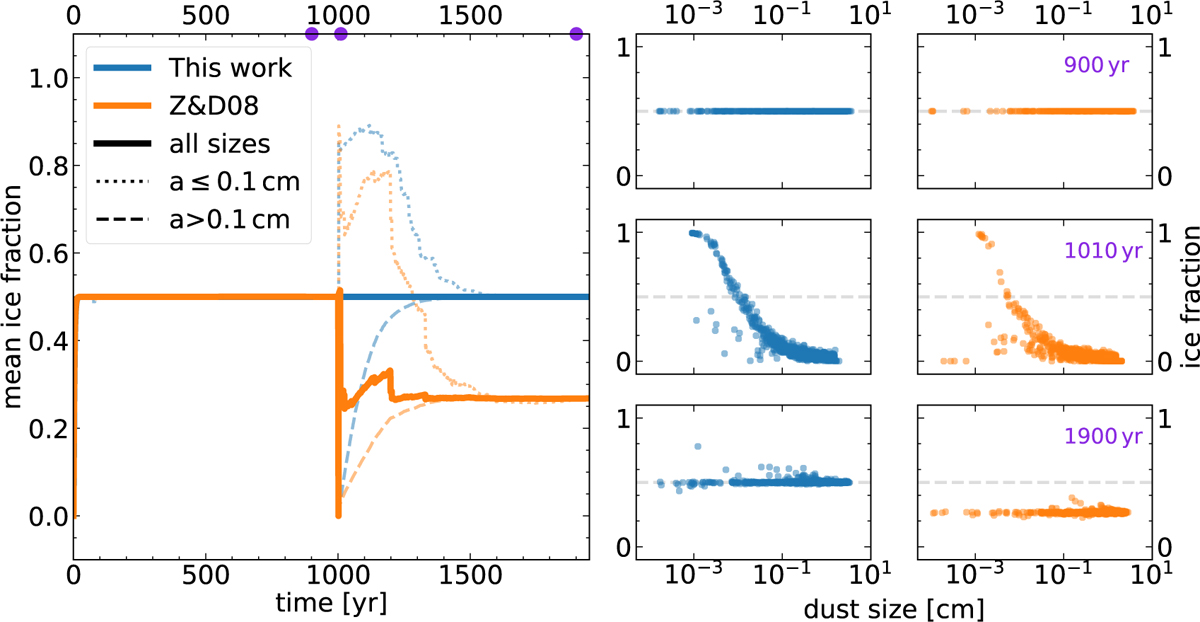
Fig. 5
Download original image
Left: mean water ice fraction of the dust population before and after an outburst-like event triggered at 1000 yr. Two independent simulations are shown: the coagulation algorithm (blue line) presented in this work and the algorithm of Zsom & Dullemond (2008) (orange line). The solid line indicates the average ice fraction over all particle sizes, the dotted line the average for small particles, and the dashed line the average for large particles. Initially, water vapor condenses almost instantaneously into particles of equal size. Later, ice sublimates during the outburst event that lasts 1 yr. Upon recondensation onto silicate grains of varying sizes, the coagulation method presented here exactly conserves the mean ice fraction, while the method by Zsom & Dullemond (2008) does not. Right: water ice fraction and sizes of every representative particle at different times for the two simulations. Before the outburst (900 yr), water is equally distributed across particles of different sizes. Following the outburst (1010 yr), small particles gain more water in proportion. At later times (1900 yr), the water fraction is again nearly equally distributed across different sizes.
Current usage metrics show cumulative count of Article Views (full-text article views including HTML views, PDF and ePub downloads, according to the available data) and Abstracts Views on Vision4Press platform.
Data correspond to usage on the plateform after 2015. The current usage metrics is available 48-96 hours after online publication and is updated daily on week days.
Initial download of the metrics may take a while.