Fig. 3.
Download original image
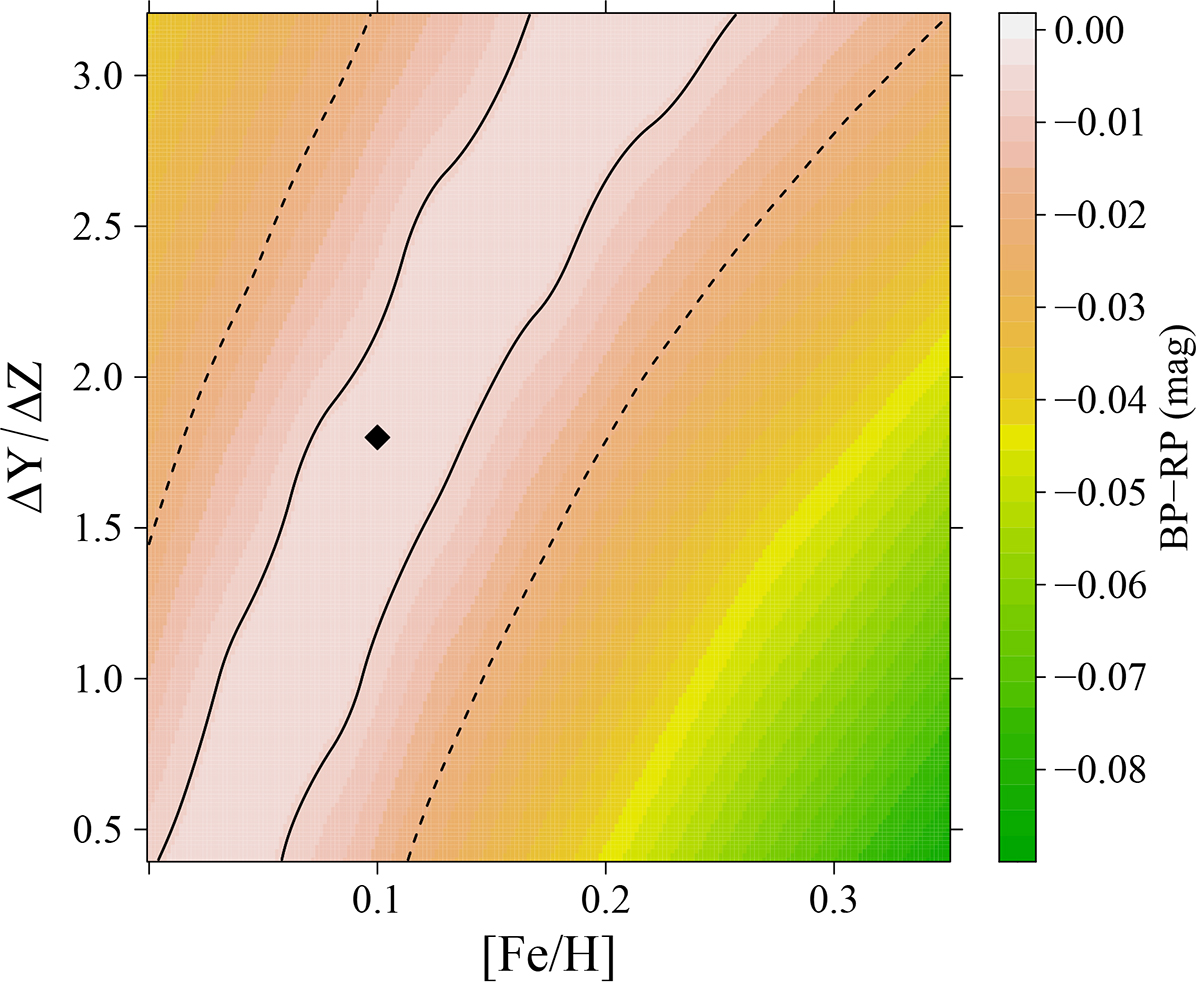
Filled contour plot of the mean absolute differences in the colour BP − RP between the reference isochrone with [Fe/H] = 0.1 and ΔY/ΔZ = 1.8, and all other isochrones in the grid (for the FRANEC MARCS set). The reference model is identified by the black diamond. Solid and dashed black lines indicate regions where the mean absolute difference is below 0.007 mag and 0.02 mag, respectively.
Current usage metrics show cumulative count of Article Views (full-text article views including HTML views, PDF and ePub downloads, according to the available data) and Abstracts Views on Vision4Press platform.
Data correspond to usage on the plateform after 2015. The current usage metrics is available 48-96 hours after online publication and is updated daily on week days.
Initial download of the metrics may take a while.