Open Access
Fig. 1.
Download original image
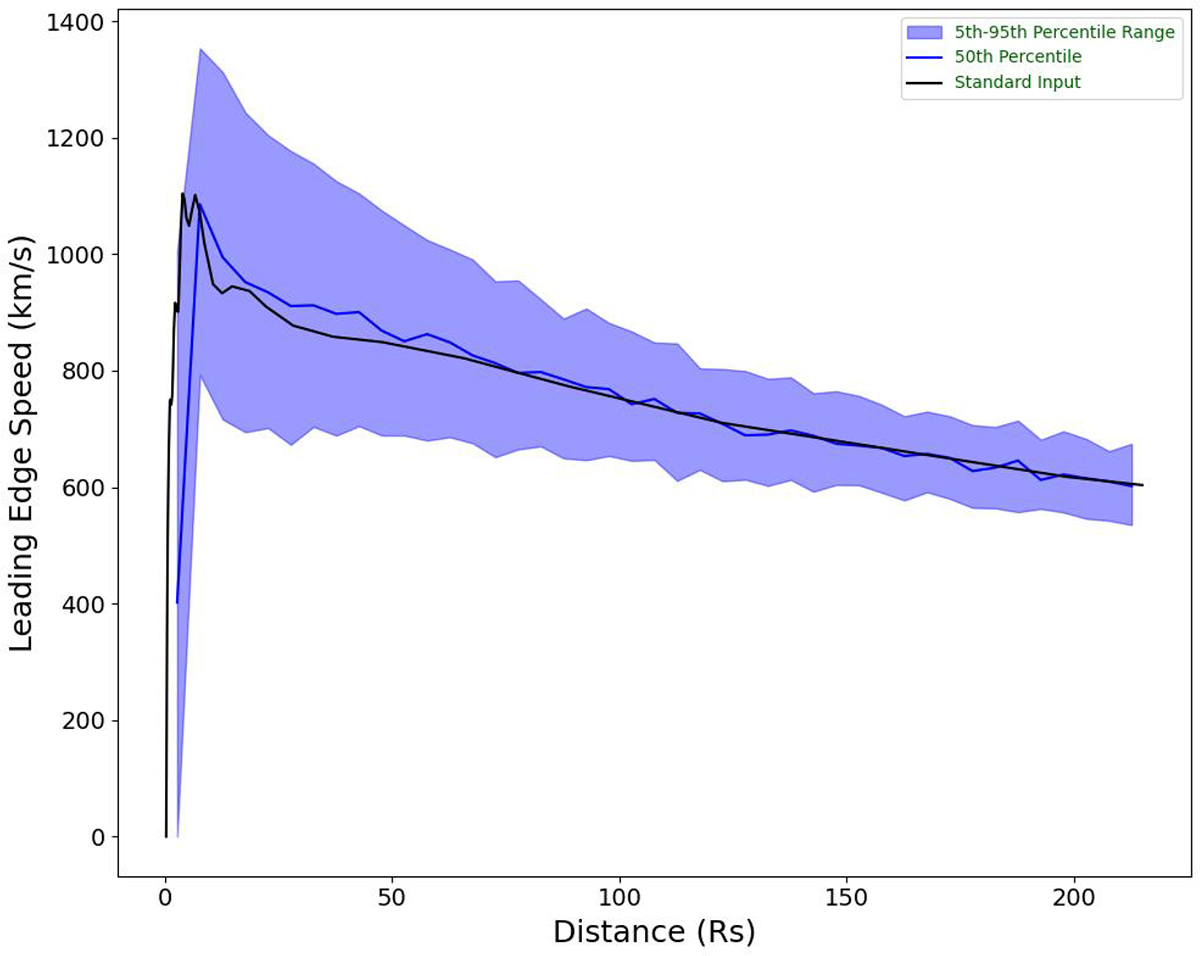
Leading-edge evolution of the CME flux rope as a function of the heliocentric distance for the 23 February 1997 event. The blue shaded region denotes the 5th–95th percentile envelope and the solid blue curve is the median. The standard-input solution is over-plotted in black.
Current usage metrics show cumulative count of Article Views (full-text article views including HTML views, PDF and ePub downloads, according to the available data) and Abstracts Views on Vision4Press platform.
Data correspond to usage on the plateform after 2015. The current usage metrics is available 48-96 hours after online publication and is updated daily on week days.
Initial download of the metrics may take a while.