Fig. D.2.
Download original image
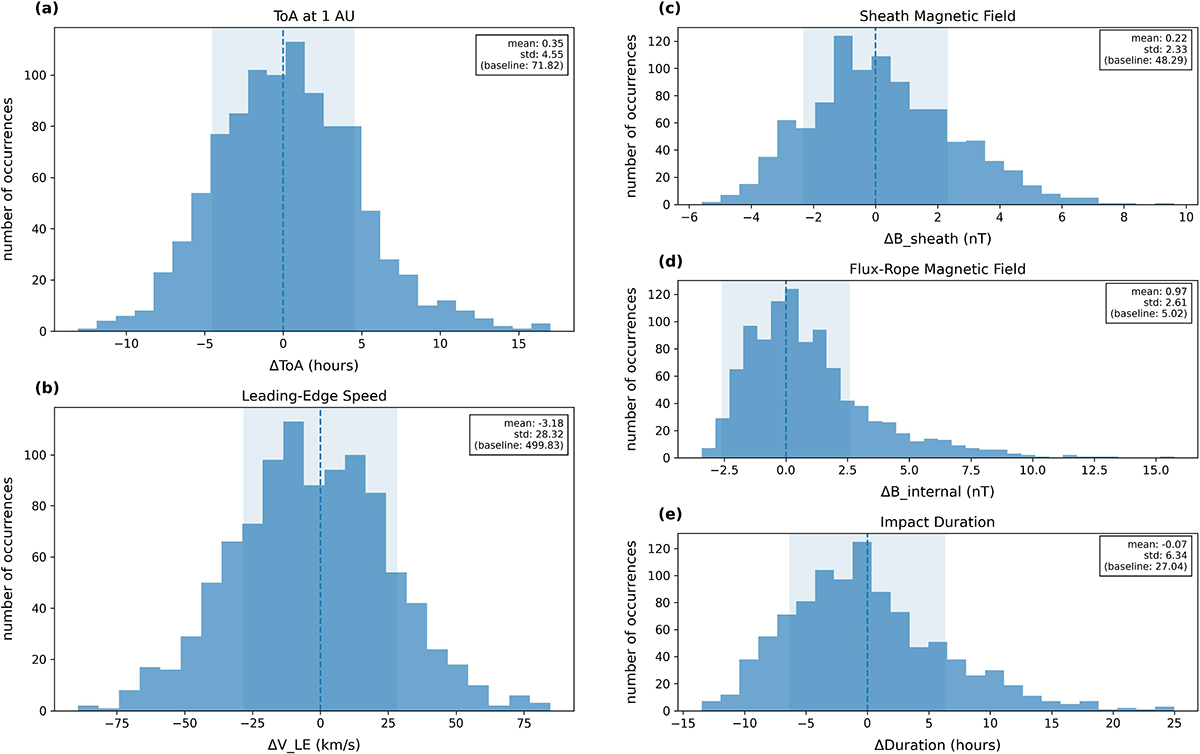
Endpoint spreads at 1 AU for the comprehensive ensemble of the 17 May 2008 event, plotted relative to the standard-input (baseline) solution. Panels show the deviations in (a) time of arrival, (b) leading-edge speed, (c) sheath magnetic-field strength, (d) internal (flux-rope) magnetic-field strength, and (e) impact duration. In each panel, the histogram is annotated with the mean offset, and a faint shaded band indicates the ±1σ spread. The dashed vertical line marks zero deviation (the standard-input solution).
Current usage metrics show cumulative count of Article Views (full-text article views including HTML views, PDF and ePub downloads, according to the available data) and Abstracts Views on Vision4Press platform.
Data correspond to usage on the plateform after 2015. The current usage metrics is available 48-96 hours after online publication and is updated daily on week days.
Initial download of the metrics may take a while.