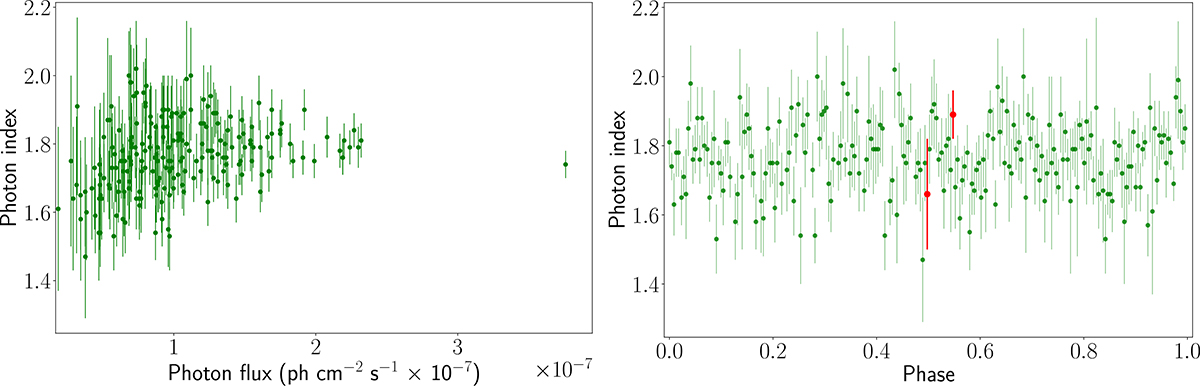
Fig. 2.
Download original image
Spectral variability of PKS 2155−304. Left: photon index vs. photon flux, showing a positive correlation (ρ ≈ 0.3), weak but robust, indicative of an atypical softer-when-brighter trend. Right: phase-resolved spectral evolution folded at the 1.7 yr period, with the 17.4-year baseline variability (green dots) consistent with an achromatic trend given the lack of significant correlation between photon index and phase (ρ = 0.036, p = 0.60), and the two consecutive 30-day bins of the extreme spectral hardening event reported by Dinesh et al. (2025, red dots).
Current usage metrics show cumulative count of Article Views (full-text article views including HTML views, PDF and ePub downloads, according to the available data) and Abstracts Views on Vision4Press platform.
Data correspond to usage on the plateform after 2015. The current usage metrics is available 48-96 hours after online publication and is updated daily on week days.
Initial download of the metrics may take a while.