Fig. 3.
Download original image
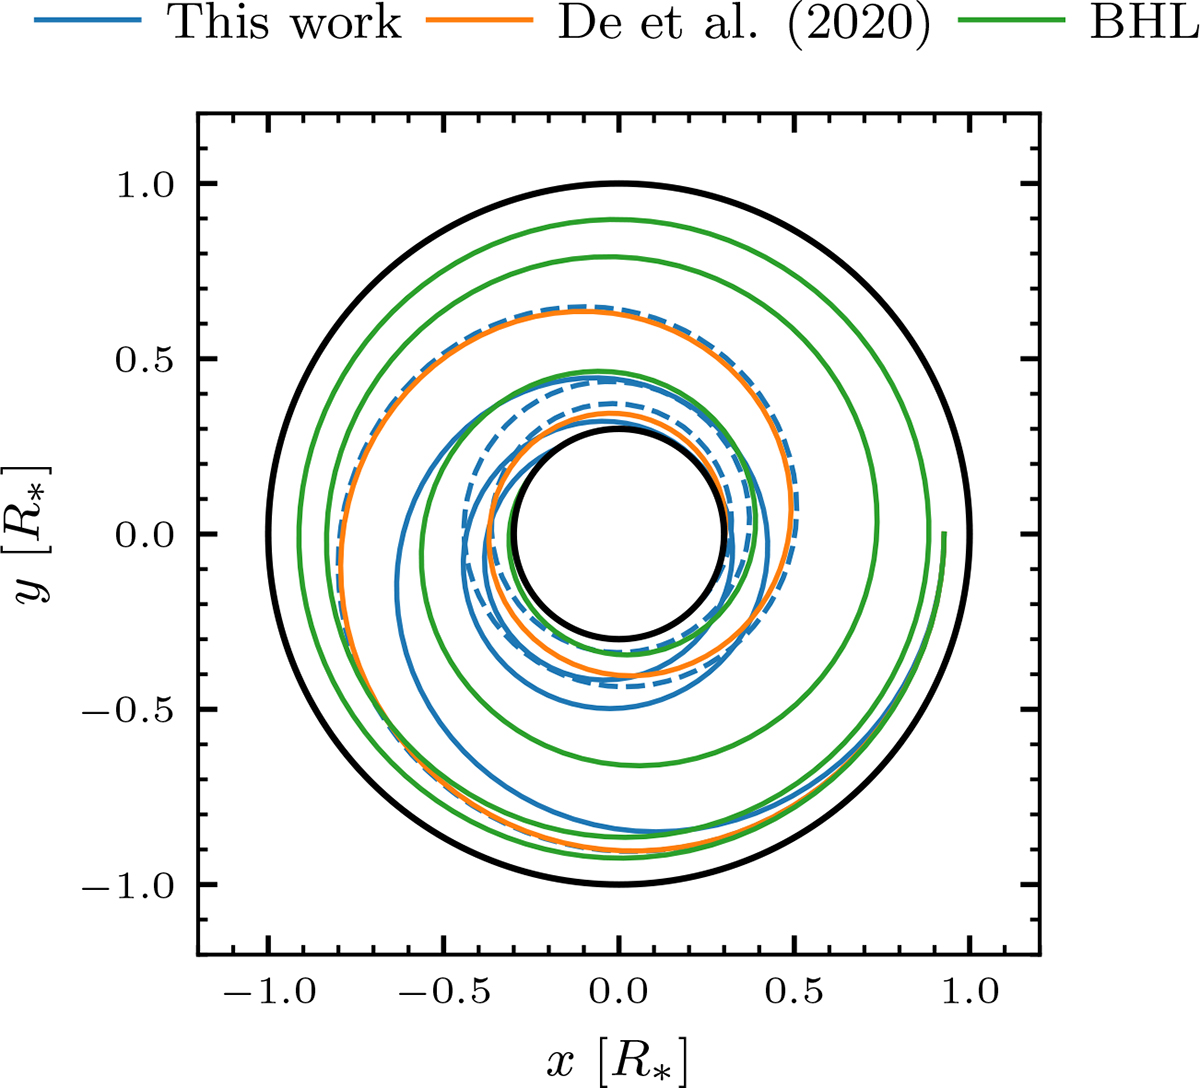
Updated Figure A.5 in Gagnier et al. (2026). Inspiral of a 0.2 M⊙ companion through the envelope of a 2 M⊙ red giant, using three drag force prescriptions. The blue curve uses our fitted drag and lift prescriptions (Eqs. 3a–3b); the orange is the prescription from De et al. (2020); the green is the Hoyle–Lyttleton formula, Fdrag = πRa2ρ∞u∞2; and the dashed blue curve uses our fitted drag prescription, but F⊥ was set to zero.
Current usage metrics show cumulative count of Article Views (full-text article views including HTML views, PDF and ePub downloads, according to the available data) and Abstracts Views on Vision4Press platform.
Data correspond to usage on the plateform after 2015. The current usage metrics is available 48-96 hours after online publication and is updated daily on week days.
Initial download of the metrics may take a while.