Fig. 3
Download original image
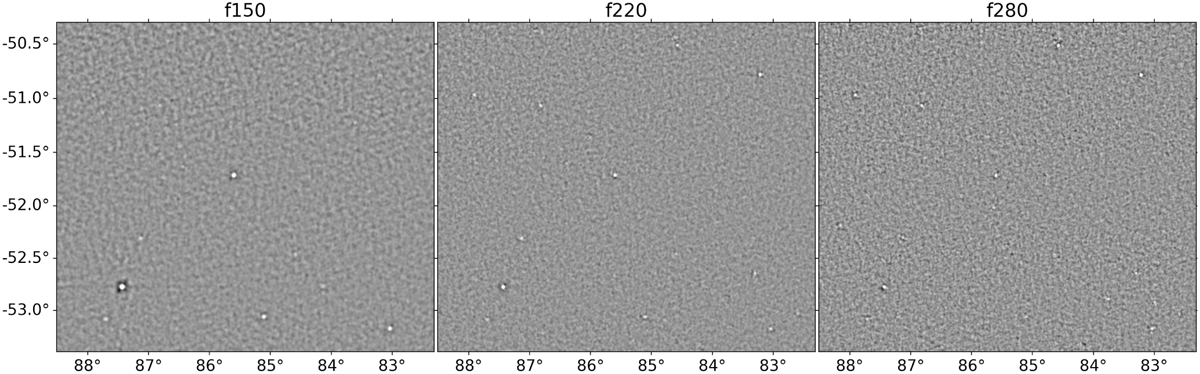
Filtered maps of a region observed in 2010 at the 150, 220, and 280 GHz bands, from left to right, respectively. The gray scale is the same for the three maps going from −25 mJy to +25 mJy. The sources are the bright spots. Dusty sources are typically undetected or have low fluxes in 150 GHz maps, but their flux rises at higher frequencies. The opposite is true for synchrotron sources: they have higher flux at the lowest frequency. Note that the angular scale of the noise fluctuations is related to the beam size in these filtered maps.
Current usage metrics show cumulative count of Article Views (full-text article views including HTML views, PDF and ePub downloads, according to the available data) and Abstracts Views on Vision4Press platform.
Data correspond to usage on the plateform after 2015. The current usage metrics is available 48-96 hours after online publication and is updated daily on week days.
Initial download of the metrics may take a while.