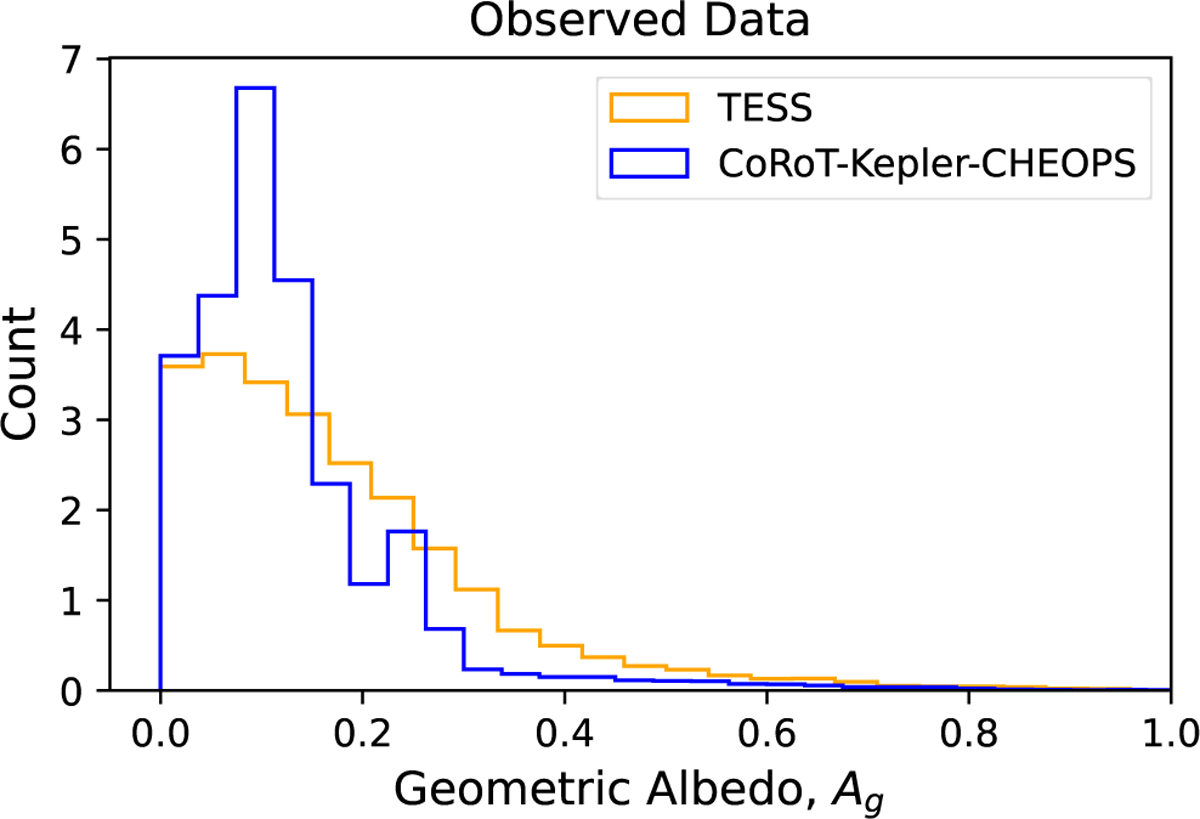
Fig. 2
Download original image
Distribution of observed geometric albedos for both bandpasses (CoRoT-Kepler-CHEOPS (CKC) in blue and TESS in orange), where each observation (from Table A.1) is treated as a Gaussian distribution with a width given by the 1-sigma uncertainty reported. This histogram plot is made from 10000 samples of each observation and then normalised. The CKC sample peaks around Ag = 0.1, whereas the TESS sample has a wider peak and has a maximum at Ag = 0. However, this could be a result of the much wider error bars in the TESS data, smoothing out any peaks.
Current usage metrics show cumulative count of Article Views (full-text article views including HTML views, PDF and ePub downloads, according to the available data) and Abstracts Views on Vision4Press platform.
Data correspond to usage on the plateform after 2015. The current usage metrics is available 48-96 hours after online publication and is updated daily on week days.
Initial download of the metrics may take a while.