Fig. 1.
Download original image
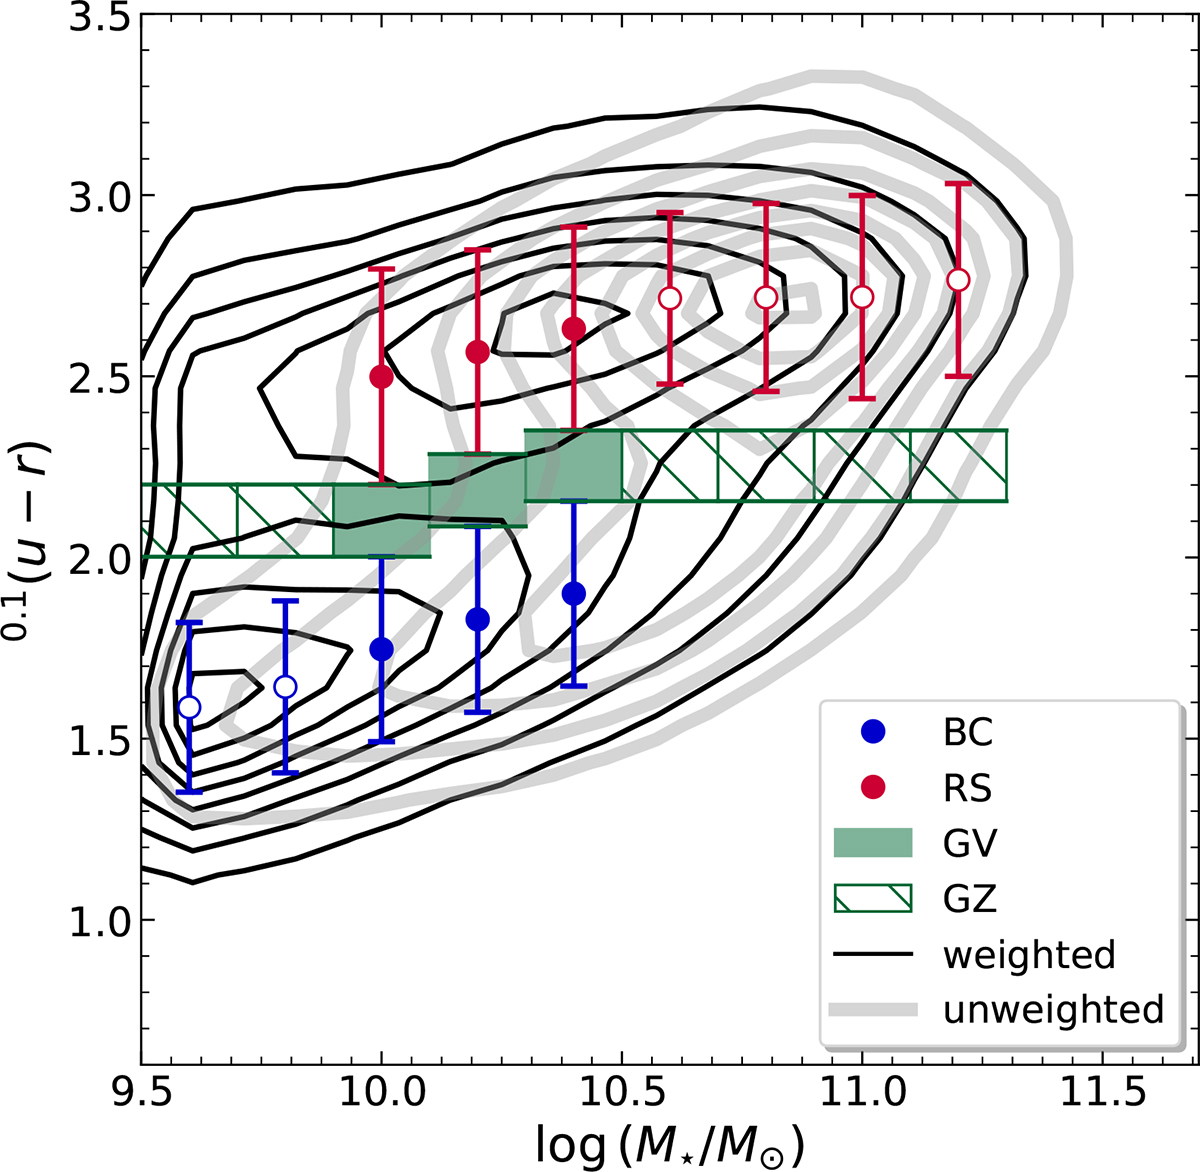
0.1(u − r) colour-stellar mass diagram (CMD) for MGS DR18 galaxies restricted to 0.025 ≤ z ≤ 0.15 and to log(M★/M⊙)≥9.5. Solid blue and red circles indicate the centres of the Gaussian components that best fit the blue and red populations, respectively. Open symbols of the same colours mark cases where only the BC or RS is present. The shaded green region indicates the GV, while the hatched area marks the GZ. Isocontours of galaxy number density are shown as black lines for the weighted distribution and grey lines for the unweighted case.
Current usage metrics show cumulative count of Article Views (full-text article views including HTML views, PDF and ePub downloads, according to the available data) and Abstracts Views on Vision4Press platform.
Data correspond to usage on the plateform after 2015. The current usage metrics is available 48-96 hours after online publication and is updated daily on week days.
Initial download of the metrics may take a while.