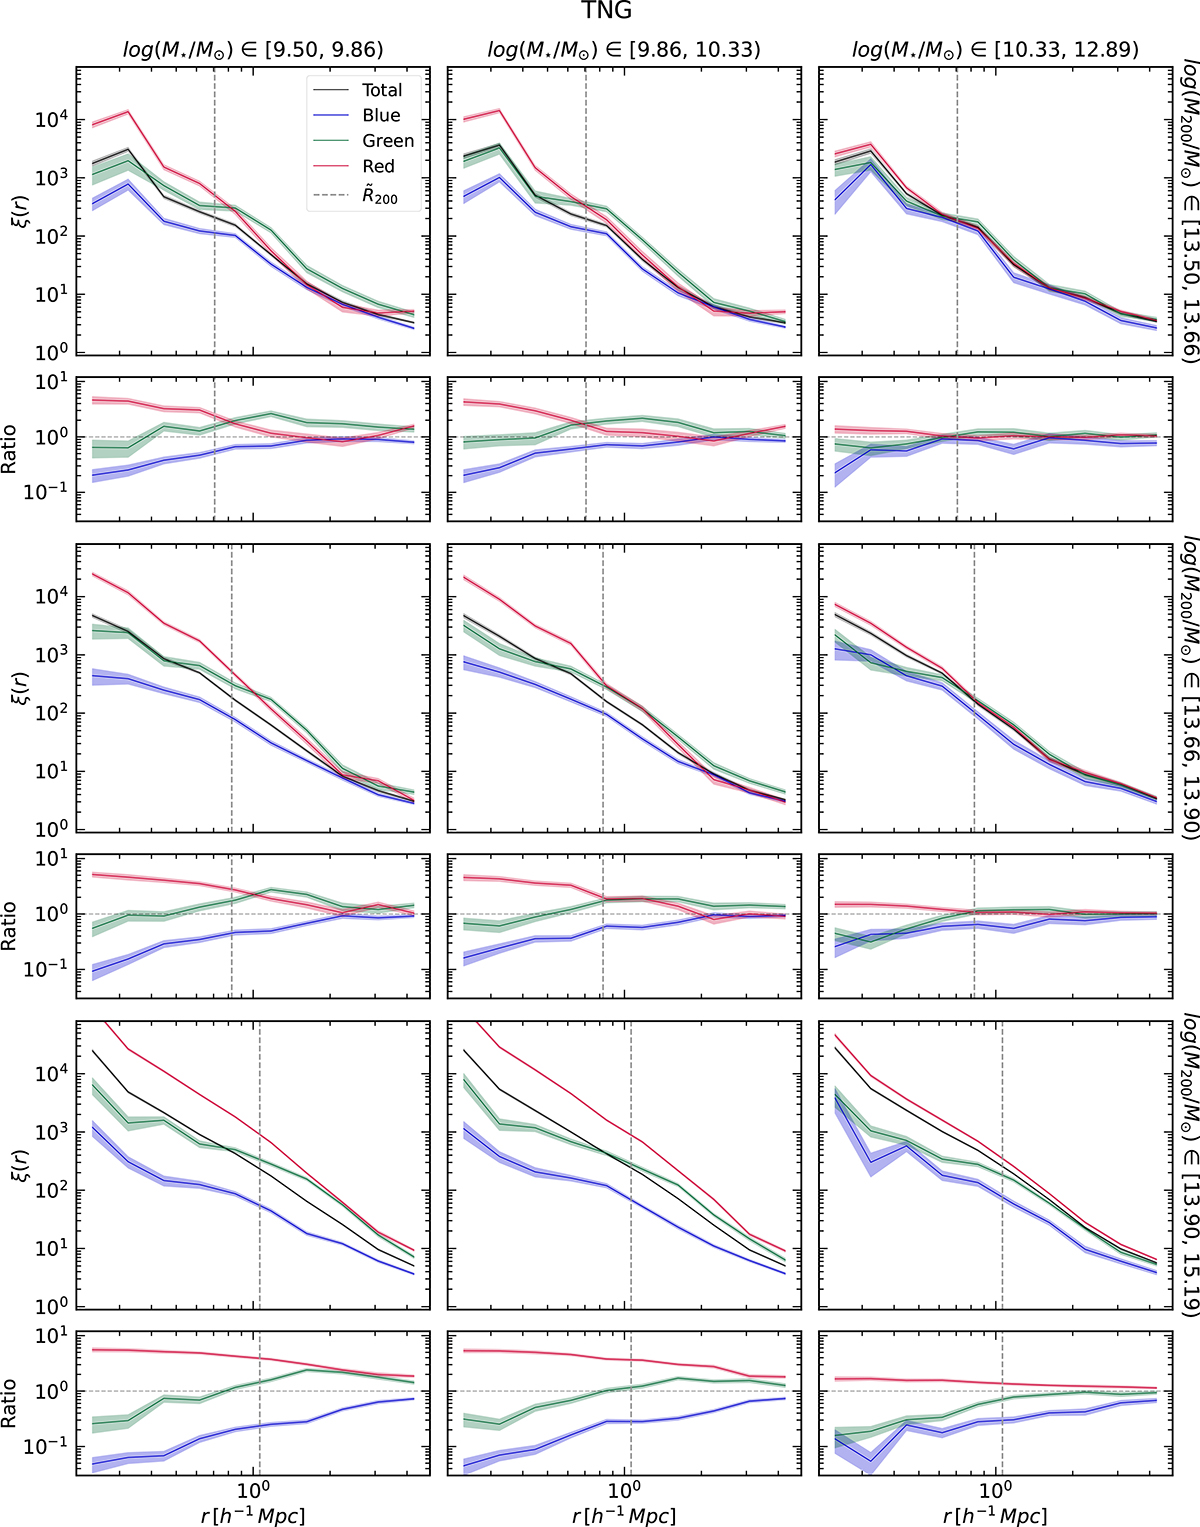
Fig. 2.
Download original image
Upper panels: Cluster–galaxy CCFs derived from the IllustrisTNG300-1 simulation. The black curve shows the full galaxy sample; blue, green, and red curves correspond to the respective colour subsamples. Rows correspond to terciles of galaxy system M200, and columns to terciles of galaxy stellar mass. Shaded regions show uncertainties estimated via jackknife resampling. Lower panels: Ratios between the CCFs of the red, green, and blue subsamples and that of the total sample. Dashed grey lines denote the median R200 corresponding to each tercile of M200.
Current usage metrics show cumulative count of Article Views (full-text article views including HTML views, PDF and ePub downloads, according to the available data) and Abstracts Views on Vision4Press platform.
Data correspond to usage on the plateform after 2015. The current usage metrics is available 48-96 hours after online publication and is updated daily on week days.
Initial download of the metrics may take a while.