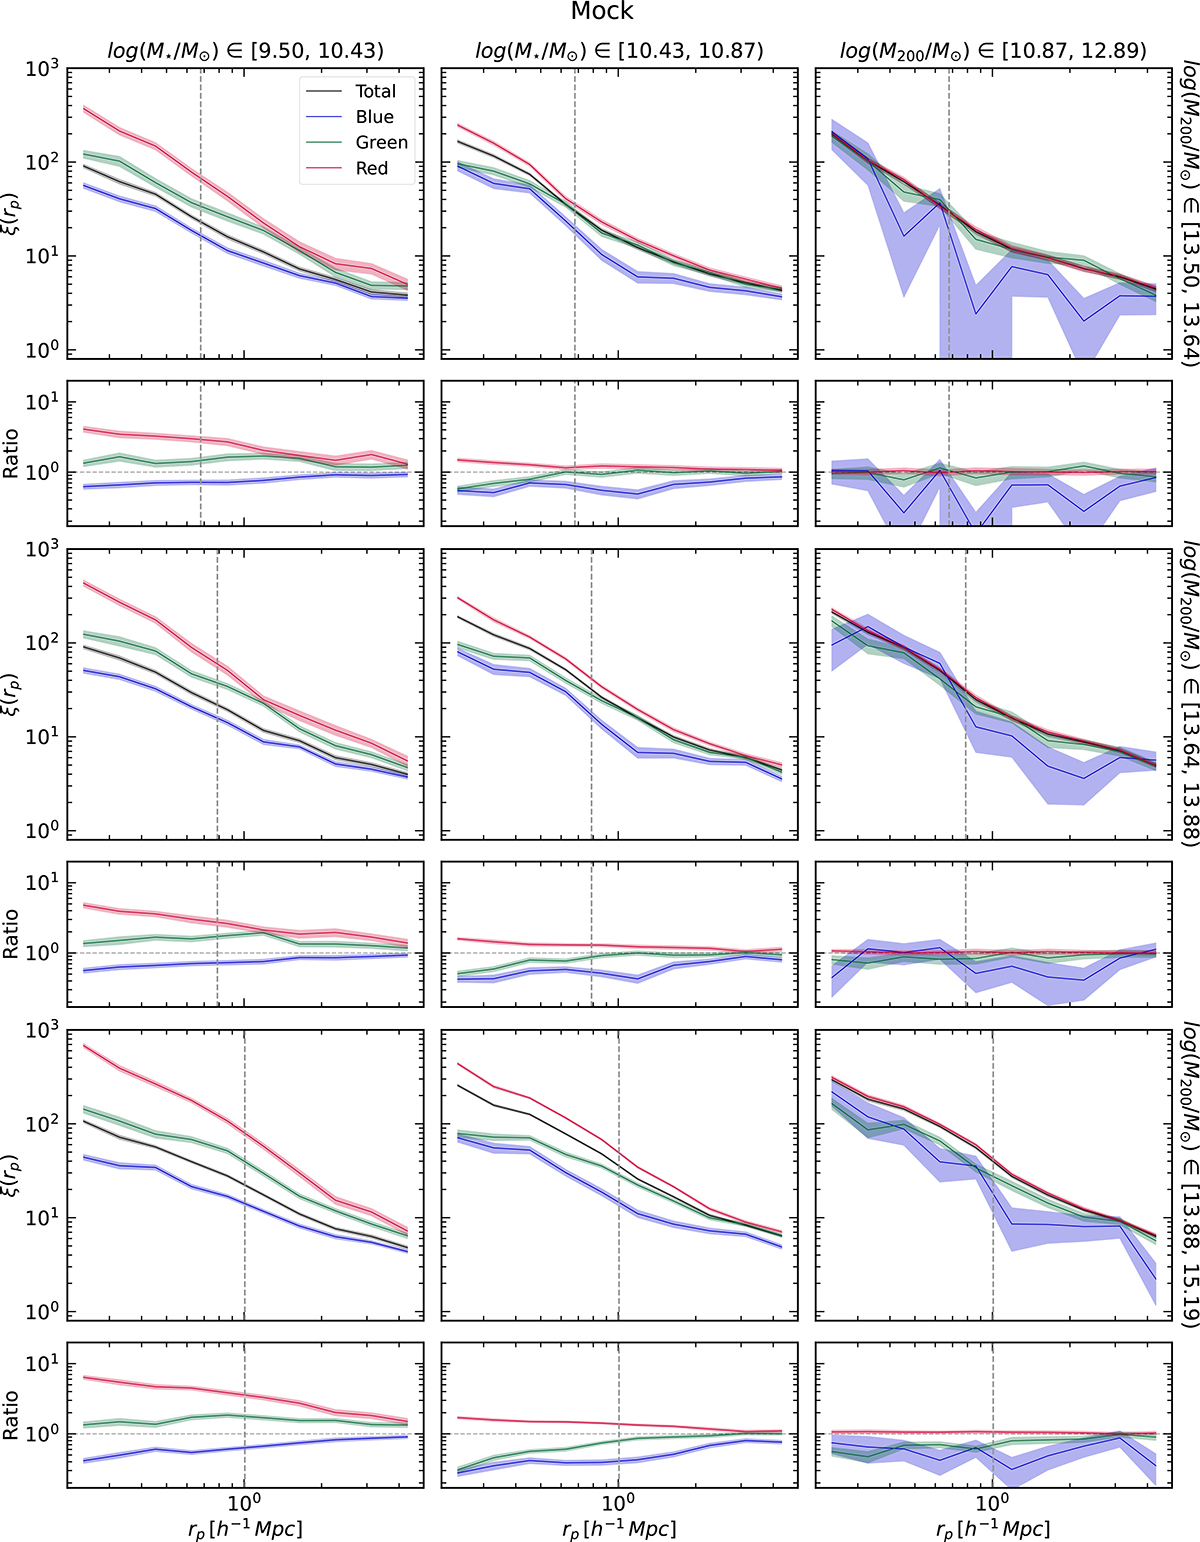
Fig. 4.
Download original image
CCFs and their ratios for the mock sample, analogous to Fig. 2. Rows correspond to terciles of galaxy system M200, and columns to terciles of galaxy stellar mass. Shaded regions indicate uncertainties estimated via jackknife resampling. The dashed grey lines indicate the median R200 for each of the respective terciles of M200.
Current usage metrics show cumulative count of Article Views (full-text article views including HTML views, PDF and ePub downloads, according to the available data) and Abstracts Views on Vision4Press platform.
Data correspond to usage on the plateform after 2015. The current usage metrics is available 48-96 hours after online publication and is updated daily on week days.
Initial download of the metrics may take a while.