Fig. A.2.
Download original image
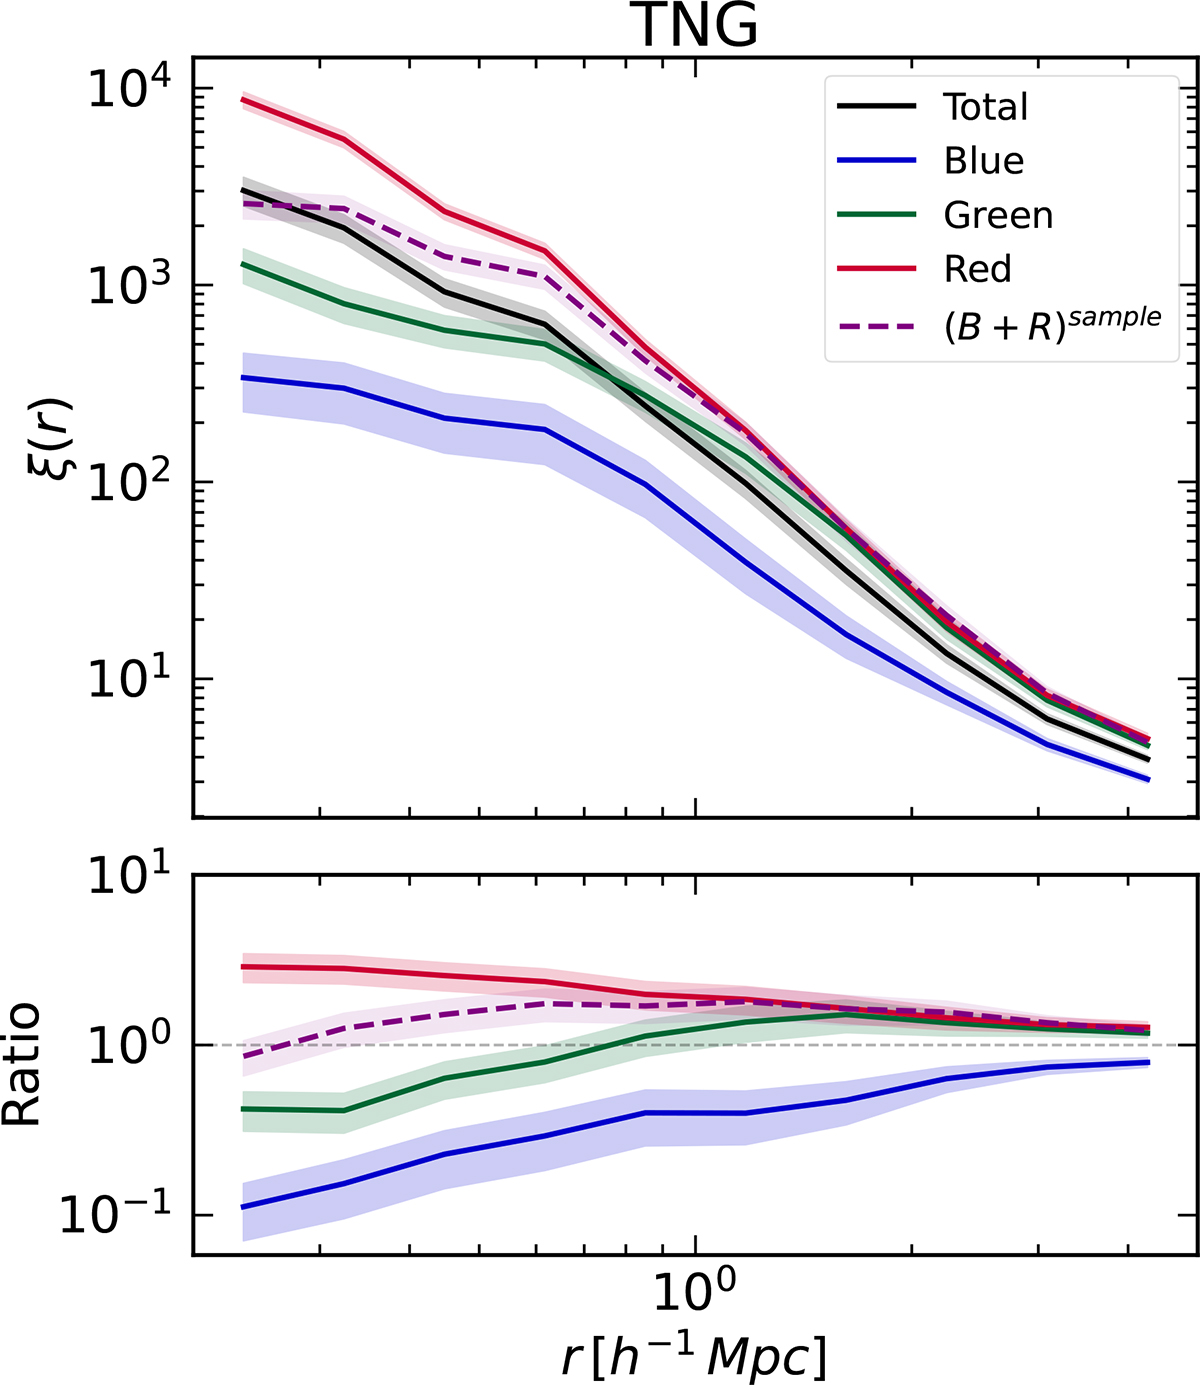
Upper panel: CCFs measured from the IllustrisTNG300-1 simulation. The black curve shows the full sample. The blue, green, and red curves correspond to the CCFs of the respective colour subsamples. The violet dashed curve shows the CCF for the (B+R) sample selected as explained in Sect. 4. Lower panels: Ratios of the CCFs of the red, green, blue, and violet subsamples to that of the total sample. Shaded regions indicate uncertainties estimated via jackknife resampling.
Current usage metrics show cumulative count of Article Views (full-text article views including HTML views, PDF and ePub downloads, according to the available data) and Abstracts Views on Vision4Press platform.
Data correspond to usage on the plateform after 2015. The current usage metrics is available 48-96 hours after online publication and is updated daily on week days.
Initial download of the metrics may take a while.