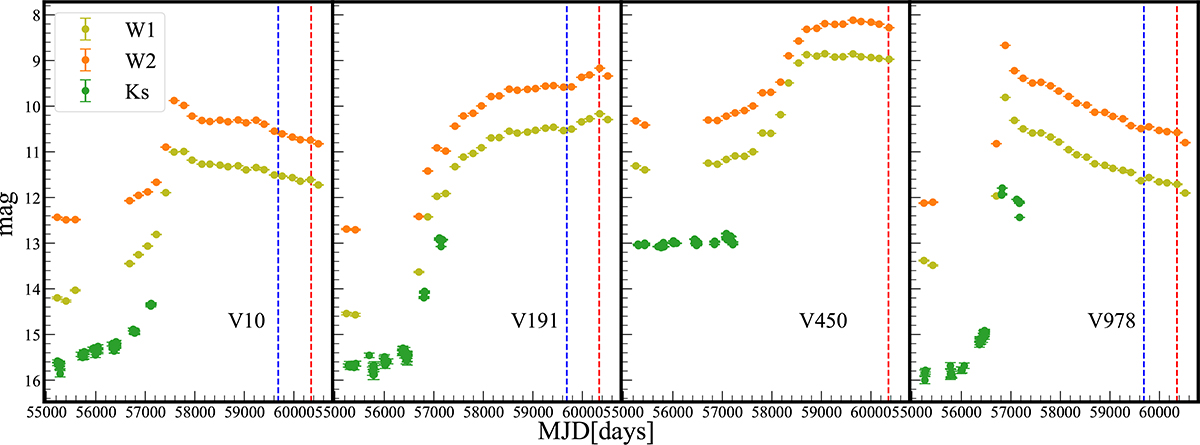
Fig. 1.
Download original image
Near-infrared and mid-infrared light curves of the four FUor candidates. We show the light curves from Ks (green), W1 (light green), and W2 (orange) bands (Minniti et al. 2010; Mainzer et al. 2014; Schlafly et al. 2019; Meisner et al. 2023). The vertical red and blue lines mark the dates of spectroscopic observations presented in this paper and Guo et al. (2024a).
Current usage metrics show cumulative count of Article Views (full-text article views including HTML views, PDF and ePub downloads, according to the available data) and Abstracts Views on Vision4Press platform.
Data correspond to usage on the plateform after 2015. The current usage metrics is available 48-96 hours after online publication and is updated daily on week days.
Initial download of the metrics may take a while.