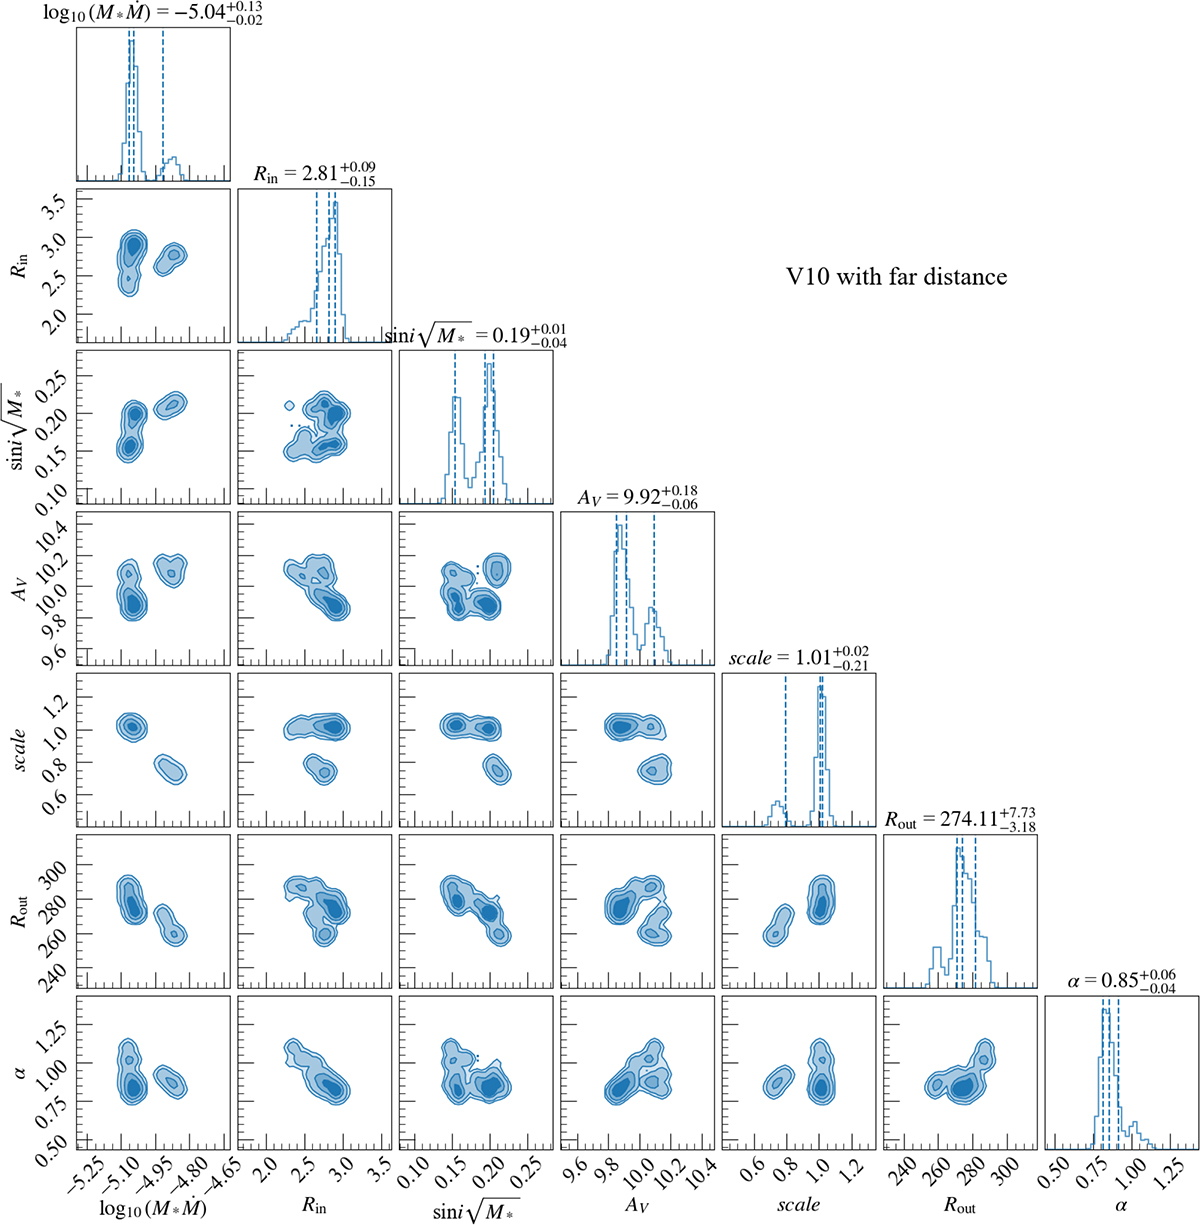
Fig. 4.
Download original image
Parameter distributions and corner plot of V10 assuming the far distance. The marginalized one-dimensional distributions are shown along the diagonal, where the dashed blue lines indicate the median and the 16th and 84th percentiles ±1σ. The two-dimensional panels show the joint posterior distributions, with contours enclosing 39%, 68%, 95%, and 99% credible regions.
Current usage metrics show cumulative count of Article Views (full-text article views including HTML views, PDF and ePub downloads, according to the available data) and Abstracts Views on Vision4Press platform.
Data correspond to usage on the plateform after 2015. The current usage metrics is available 48-96 hours after online publication and is updated daily on week days.
Initial download of the metrics may take a while.