Fig. 5.
Download original image
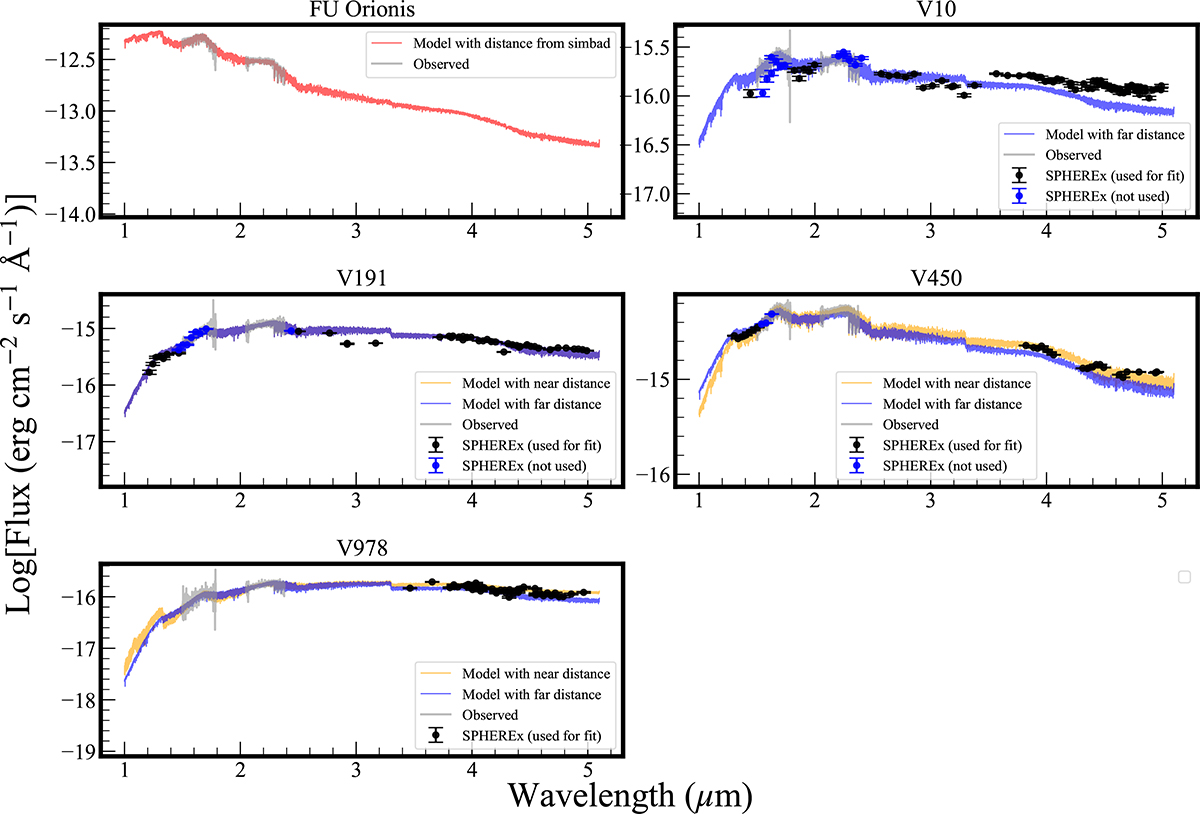
Comparison between the observed spectra and the corresponding best-fit model spectra for the sample objects. The gray lines display the observed near-infrared spectra in the H and K bands. The colored lines show the model spectra derived under different distance assumptions: the distance estimated from the parallax measurement compiled in the SIMBAD database (red), the near-distance solution (orange), and the far-distance solution (blue). Black circles with error bars mark the SPHEREx spectral data points included in the fit, whereas blue circles indicate SPHEREx measurements excluded from the fitting procedure because they were used for flux calibration. All spectra are plotted on a logarithmic flux scale.
Current usage metrics show cumulative count of Article Views (full-text article views including HTML views, PDF and ePub downloads, according to the available data) and Abstracts Views on Vision4Press platform.
Data correspond to usage on the plateform after 2015. The current usage metrics is available 48-96 hours after online publication and is updated daily on week days.
Initial download of the metrics may take a while.