Fig. 6.
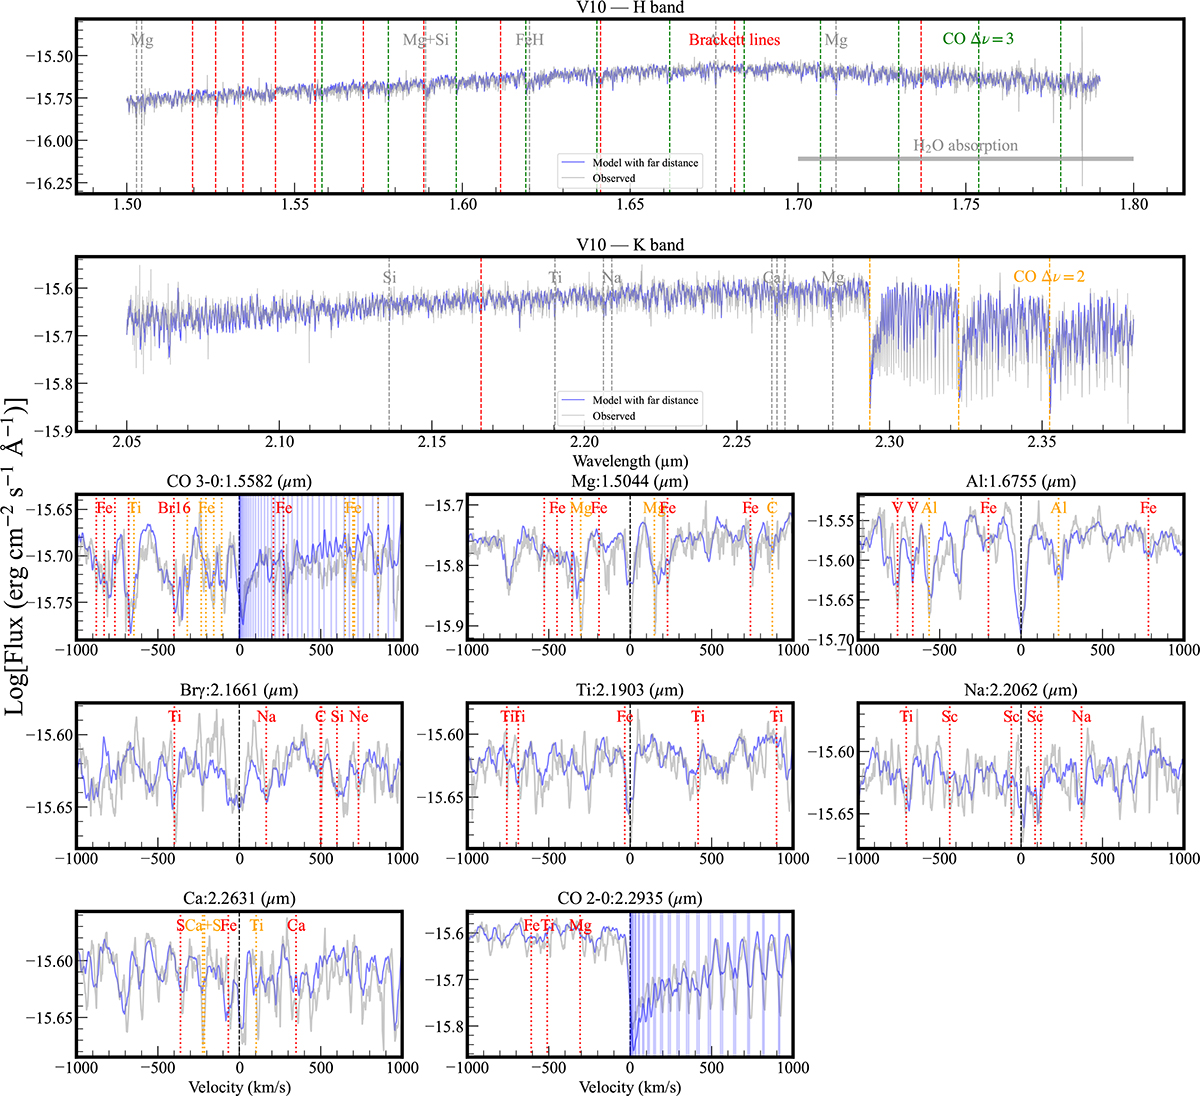
Download original image
Near-infrared H-band spectra (top panel) and K-band spectra (second panel) of V10 compared with best-fitting disk models. The gray curve shows the observed spectrum after telluric and flux calibration, while colored curves represent model spectra computed using different distance assumptions: red for the distance derived from parallax measurement compiled in the SIMBAD database, orange for the near kinematic distance, and blue for the far kinematic distance (when applicable). Vertical dashed lines mark prominent atomic transitions (gray), Brackett lines (red), and CO overtone band heads (green), as labeled. The shaded region in the H band indicates strong H2O absorption. Lower panels: Zoomed-in views of selected spectral lines in velocity space, centered on the rest wavelength of each transition. The vertical dashed line at zero velocity marks the line center, and nearby atomic and molecular transitions are indicated by vertical markers. Atomic lines are shown in red and orange to visually separate closely spaced transitions and their labels, while the molecular transitions (blue) shown in the first and eighth lower panels correspond to different rotational transitions within the same vibrational band. Observed spectra are shown in gray, and model spectra follow the same color coding as in the upper panels.
Current usage metrics show cumulative count of Article Views (full-text article views including HTML views, PDF and ePub downloads, according to the available data) and Abstracts Views on Vision4Press platform.
Data correspond to usage on the plateform after 2015. The current usage metrics is available 48-96 hours after online publication and is updated daily on week days.
Initial download of the metrics may take a while.