Fig. 12
Download original image
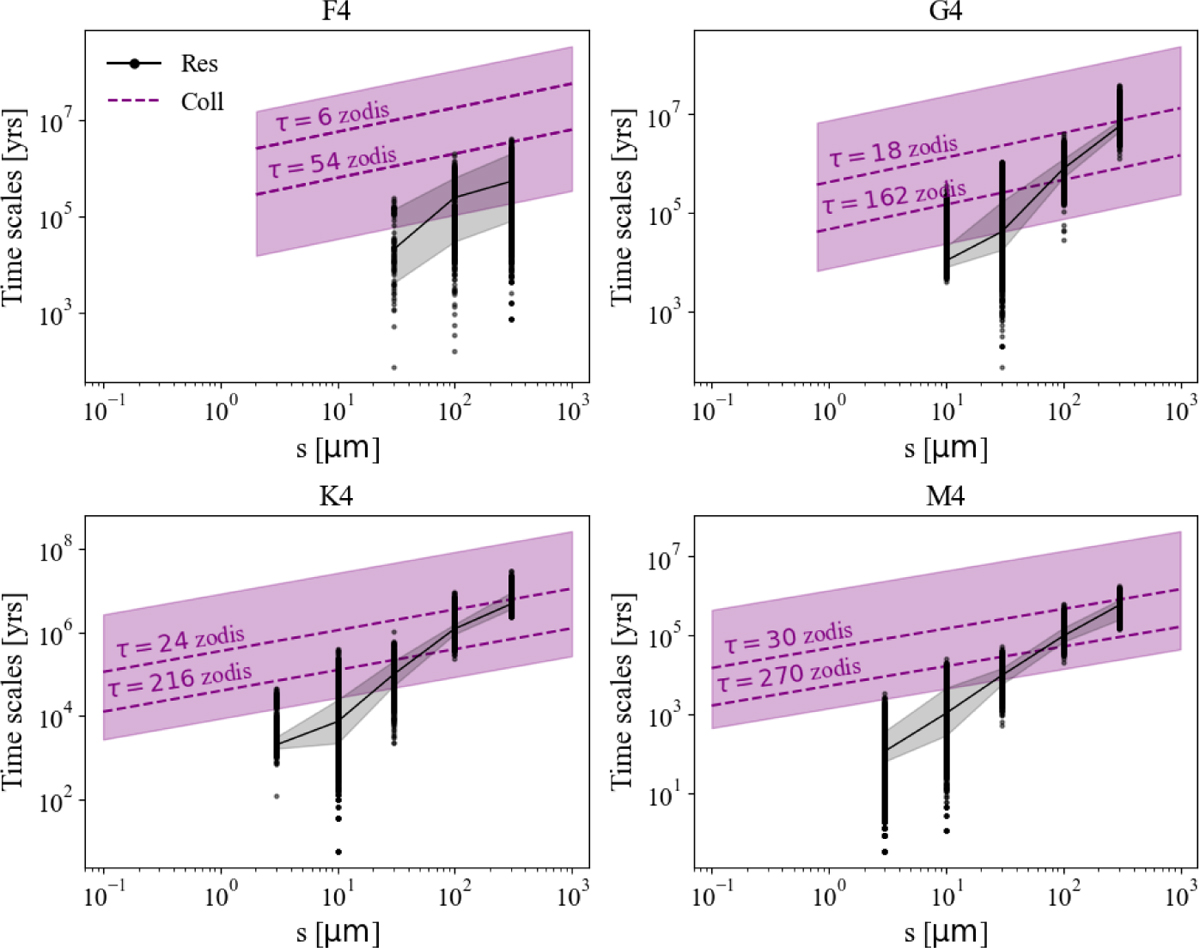
Comparison of timescales for resonant trapping from simulation data (black dots) with the median values (solid black lines) and 1σ uncertainties (gray bands), against the collisional timescale corresponding to the maximum resonant ring optical depth of τBG ∙ ⟨Cτ⟩ (dashed purple lines). For each ⟨Cτ⟩ value of ∼2, 6, 8, and 10 for F, G, K, and M-types stars, τBG values of 3 (upper dashed line) and 27 zodis (lower dashed line) are examined (see Sect. 3.2.2). Other plotting conventions are identical to those in Fig. 11.
Current usage metrics show cumulative count of Article Views (full-text article views including HTML views, PDF and ePub downloads, according to the available data) and Abstracts Views on Vision4Press platform.
Data correspond to usage on the plateform after 2015. The current usage metrics is available 48-96 hours after online publication and is updated daily on week days.
Initial download of the metrics may take a while.