Fig. B.2
Download original image
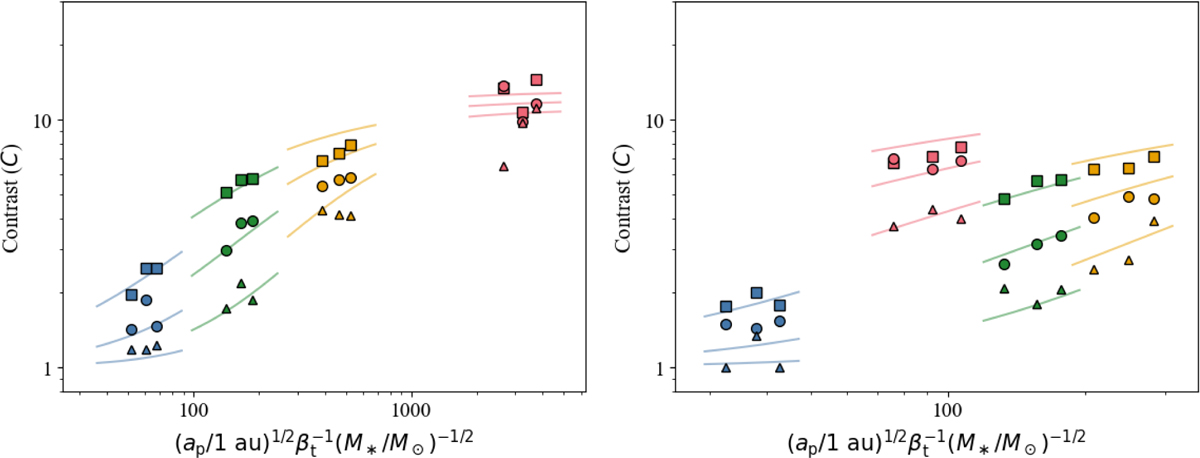
Same data as Fig. 4, but plotted against the modified term ![]() for Model I (left) and Model II (right). The tangential effective beta term βt = βPR (1 + ψ) (see Eq. 7) is used for convenience. See the caption in Fig. 4 for details on colors and symbols. The solid lines show new fits (see Eq. 14 for functional form), truncated to remain within the range relevant to each spectral type for clarity, as the contrast depends on both M* and Mp unlike the original fits from Stark & Kuchner (2008). Multiple lines of the same color correspond to different Mp, increasing from bottom to top. The x-axis scale in the right panel is reduced compared to Fig. 4, reflecting variations in ψ.
for Model I (left) and Model II (right). The tangential effective beta term βt = βPR (1 + ψ) (see Eq. 7) is used for convenience. See the caption in Fig. 4 for details on colors and symbols. The solid lines show new fits (see Eq. 14 for functional form), truncated to remain within the range relevant to each spectral type for clarity, as the contrast depends on both M* and Mp unlike the original fits from Stark & Kuchner (2008). Multiple lines of the same color correspond to different Mp, increasing from bottom to top. The x-axis scale in the right panel is reduced compared to Fig. 4, reflecting variations in ψ.
Current usage metrics show cumulative count of Article Views (full-text article views including HTML views, PDF and ePub downloads, according to the available data) and Abstracts Views on Vision4Press platform.
Data correspond to usage on the plateform after 2015. The current usage metrics is available 48-96 hours after online publication and is updated daily on week days.
Initial download of the metrics may take a while.