Fig. 1.
Download original image
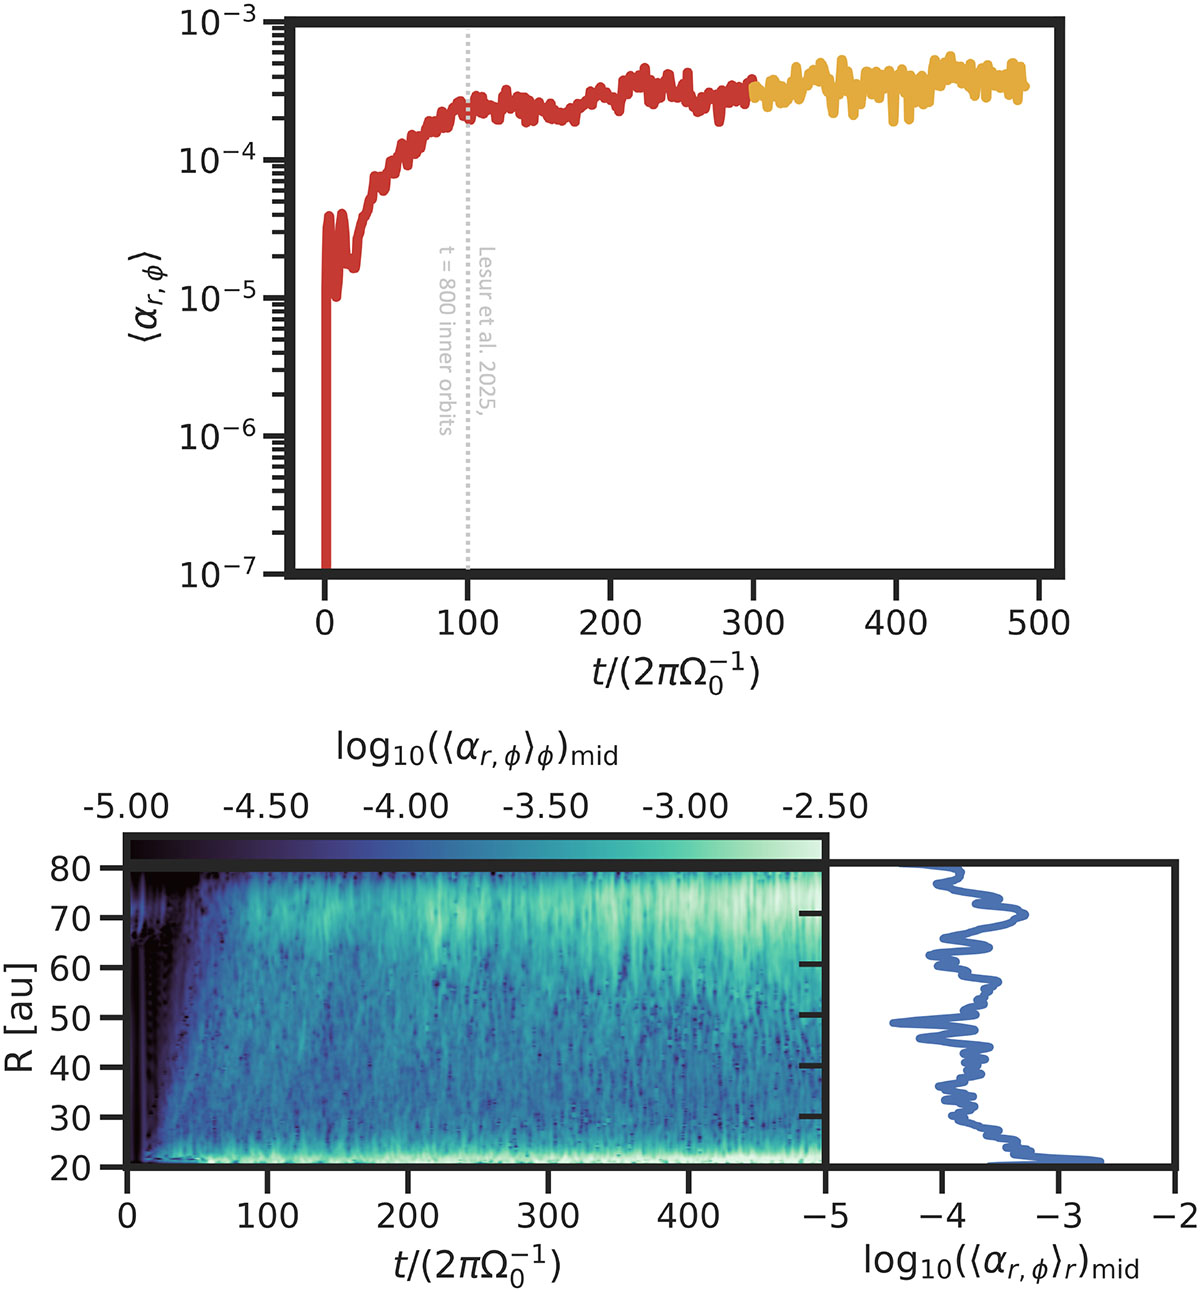
Reynolds stress-to-pressure ratio, αr, ϕ. The top panel shows the time-averaged αr, ϕ, where the yellow line represents the convergence value, ⟨αr, ϕ⟩ = 3 × 10⁻⁴. For reference, the vertical dotted line corresponds to the outer local orbit at 0.25 R0 used by Lesur et al. (2025) in their analysis, as shown in their Figure 1. The bottom-left panel displays the time series of αr, ϕ in the r-direction, averaged over azimuth in the 3D VSI-active disk. The bottom-right panel presents the radial Reynolds stress-to-pressure ratio over the time series and averaged in the azimuthal directions.
Current usage metrics show cumulative count of Article Views (full-text article views including HTML views, PDF and ePub downloads, according to the available data) and Abstracts Views on Vision4Press platform.
Data correspond to usage on the plateform after 2015. The current usage metrics is available 48-96 hours after online publication and is updated daily on week days.
Initial download of the metrics may take a while.