Fig. 13.
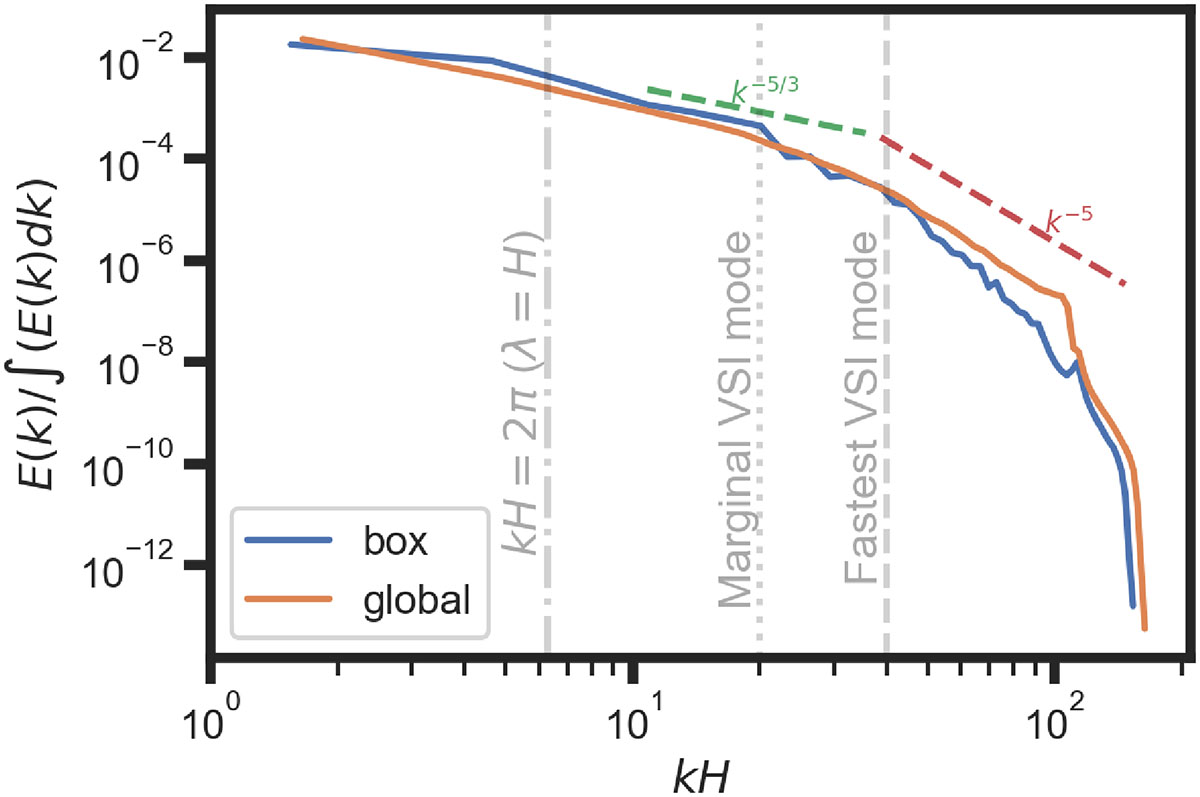
Download original image
Energy spectrum for a small box extracted from the simulation domain (blue curve) and for the full domain (orange curve) at 400 orbits. Overplotted are two power laws, k−5/3 and k−5 illustrating the Kolmogorov regime and a steeper dissipation regime, respectively. The dotted and dashed vertical gray lines mark the wavenumbers corresponding to the marginal and fastest-growing VSI modes, based on the prescription from Umurhan et al. (2016). The dash-dotted vertical line denotes to the mode whose wavelength equals the local disk scale height λ = H, corresponding to kH = 2π.
Current usage metrics show cumulative count of Article Views (full-text article views including HTML views, PDF and ePub downloads, according to the available data) and Abstracts Views on Vision4Press platform.
Data correspond to usage on the plateform after 2015. The current usage metrics is available 48-96 hours after online publication and is updated daily on week days.
Initial download of the metrics may take a while.