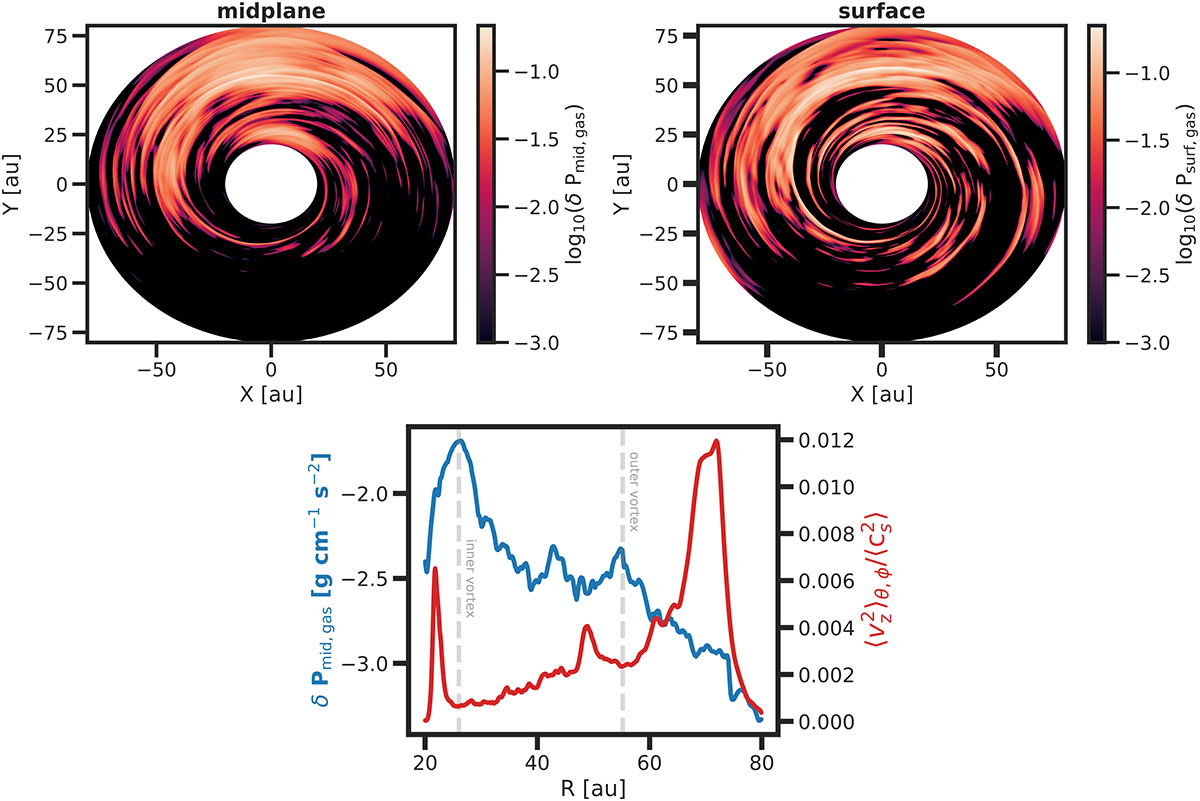
Fig. D.1.
Download original image
Perturbed gas pressure structure in the midplane in logarithmic scale (top left) and in the surface (top right) of the global domain. Bottom panel shows the radial maximum gas pressure (blue curve) and the rms of the vertical velocity (red curve), vrms. At the location of the inner vortex and outer vortex we observe the pressure bumps following by a reduced vrms demonstrating that vortices are weak turbulence features in the disk.
Current usage metrics show cumulative count of Article Views (full-text article views including HTML views, PDF and ePub downloads, according to the available data) and Abstracts Views on Vision4Press platform.
Data correspond to usage on the plateform after 2015. The current usage metrics is available 48-96 hours after online publication and is updated daily on week days.
Initial download of the metrics may take a while.