Fig. 8.
Download original image
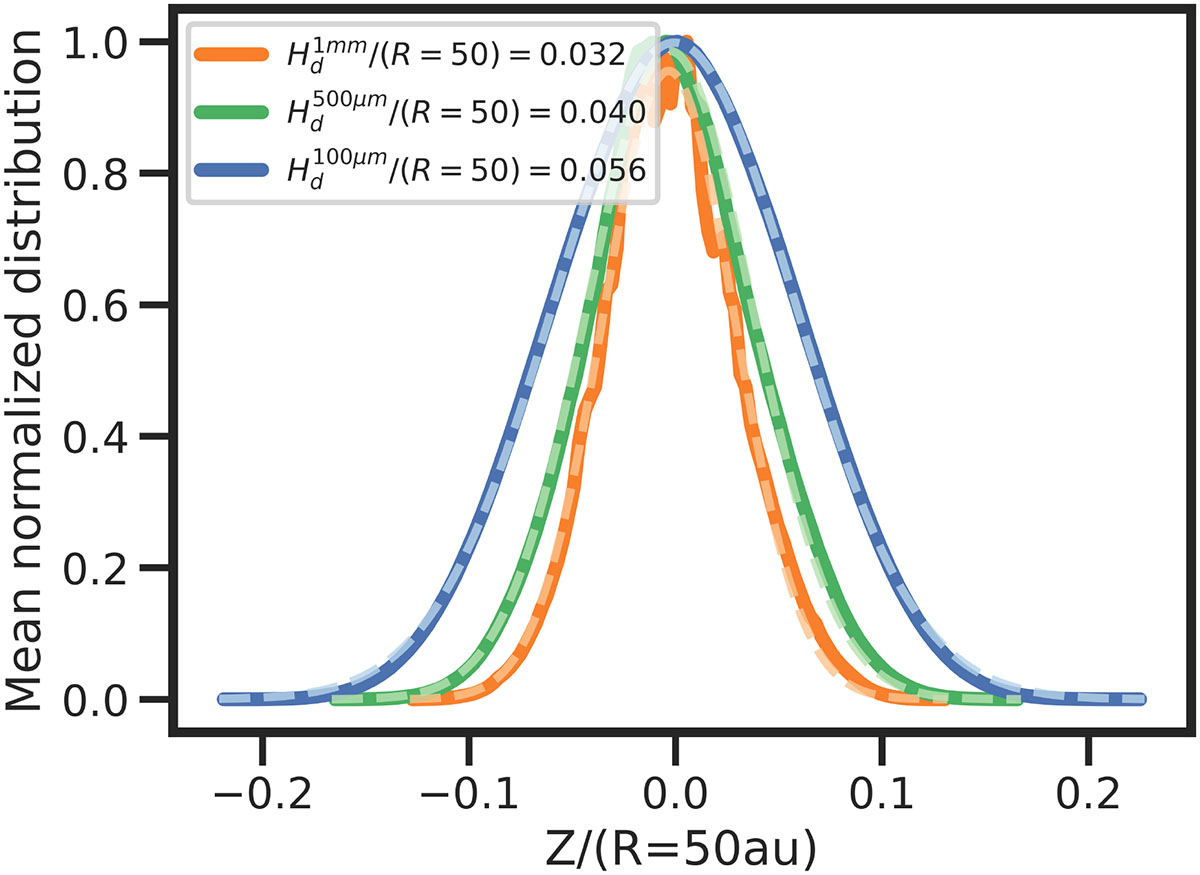
Mean vertical dust distribution, Z, averaged over the radial range 40–50 au and over time after 300 orbits. Colored lines show the mean normalized distributions for 1 mm (orange), 500 μm (green), and 100 μm (blue) grain sizes. The standard deviation of each distribution corresponds to the dust scale height (Hd) for the respective grain size.
Current usage metrics show cumulative count of Article Views (full-text article views including HTML views, PDF and ePub downloads, according to the available data) and Abstracts Views on Vision4Press platform.
Data correspond to usage on the plateform after 2015. The current usage metrics is available 48-96 hours after online publication and is updated daily on week days.
Initial download of the metrics may take a while.