Fig. 13.
Download original image
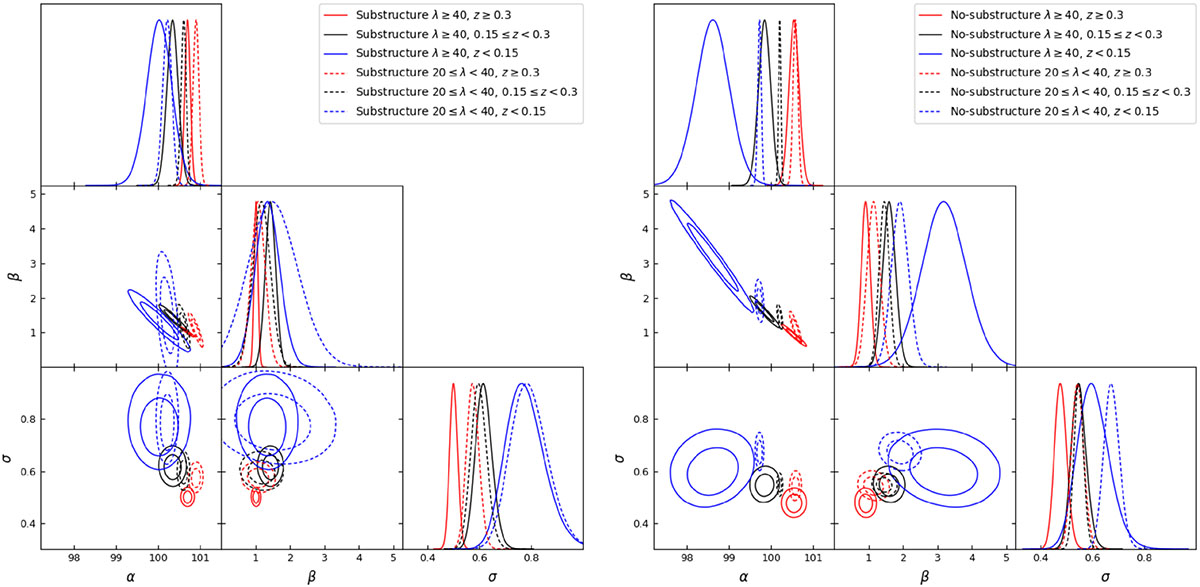
Effect of substructure on the redshift and richness-dependent trends on the Lx − λ scaling relation without the λ > z × 100 limitation. Left panel: Clusters with substructure. Right panel: Clusters without substructure. Red shows z ≥ 0.3, black 0.15 ≤ z < 0.3, and blue z < 0.15. Solid lines show λ ≥ 40 samples, and dashed lines 20 ≤ λ < 40 samples.
Current usage metrics show cumulative count of Article Views (full-text article views including HTML views, PDF and ePub downloads, according to the available data) and Abstracts Views on Vision4Press platform.
Data correspond to usage on the plateform after 2015. The current usage metrics is available 48-96 hours after online publication and is updated daily on week days.
Initial download of the metrics may take a while.