Fig. 5.
Download original image
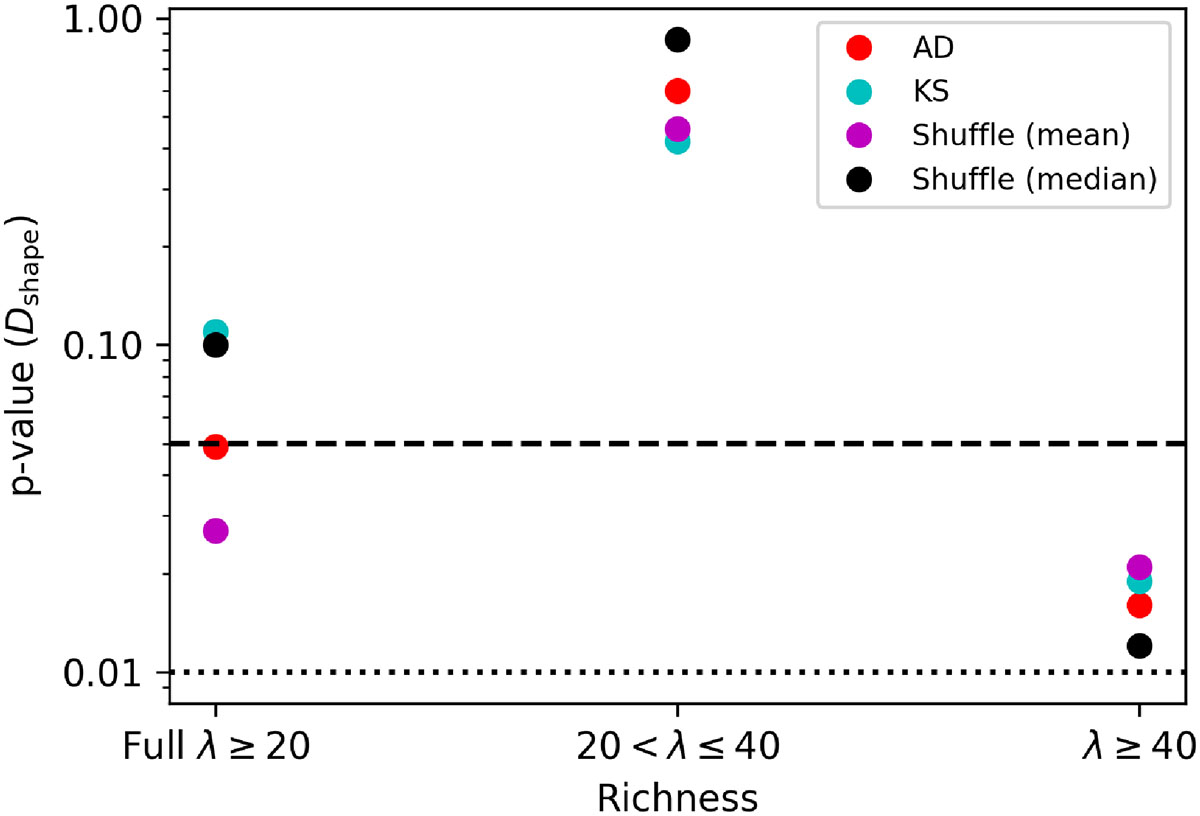
p-values for the comparison of DShape distributions for the full λ ≥ 20 sample and the two richness bins. Results from the AD tests are shown in red, the KS tests in cyan, and the permutation tests in purple (mean) and black (median). The horizontal dashed and dotted black lines indicate the 0.05 and 0.01 significance levels, respectively.
Current usage metrics show cumulative count of Article Views (full-text article views including HTML views, PDF and ePub downloads, according to the available data) and Abstracts Views on Vision4Press platform.
Data correspond to usage on the plateform after 2015. The current usage metrics is available 48-96 hours after online publication and is updated daily on week days.
Initial download of the metrics may take a while.